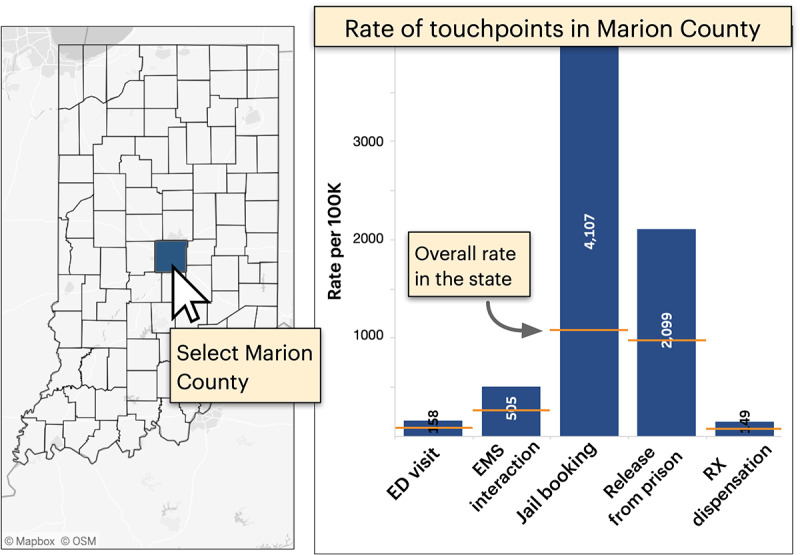
Figure 3.

Rates showing the fraction of individuals who experienced a fatal overdose for every 100,000 people who use a touchpoint (right). A map allows the user to filter the data by county, in this example, to show rates for Marion County only. Orange dash marks depict the state average for context. ED: emergency department; EMS: emergency medical services; Rx: medical prescription.
