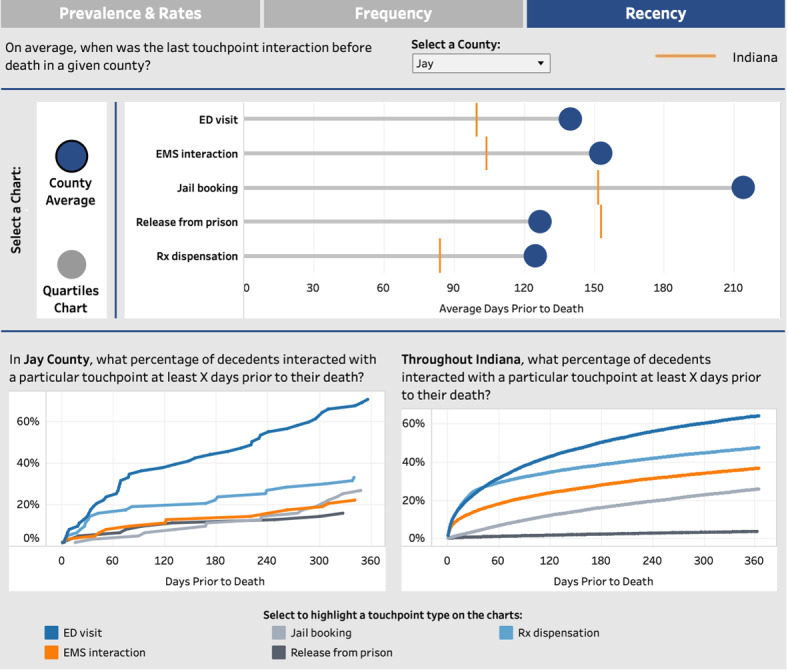
Figure 5.

The average time gap between the final interaction and overdose events across different touchpoints (top). The lower section comprises 2 charts demonstrating the cumulative reach of touchpoints at varying time intervals, comparing the selected county (bottom left) with the state average (bottom right). ED: emergency department; EMS: emergency medical services; Rx: medical prescription.
