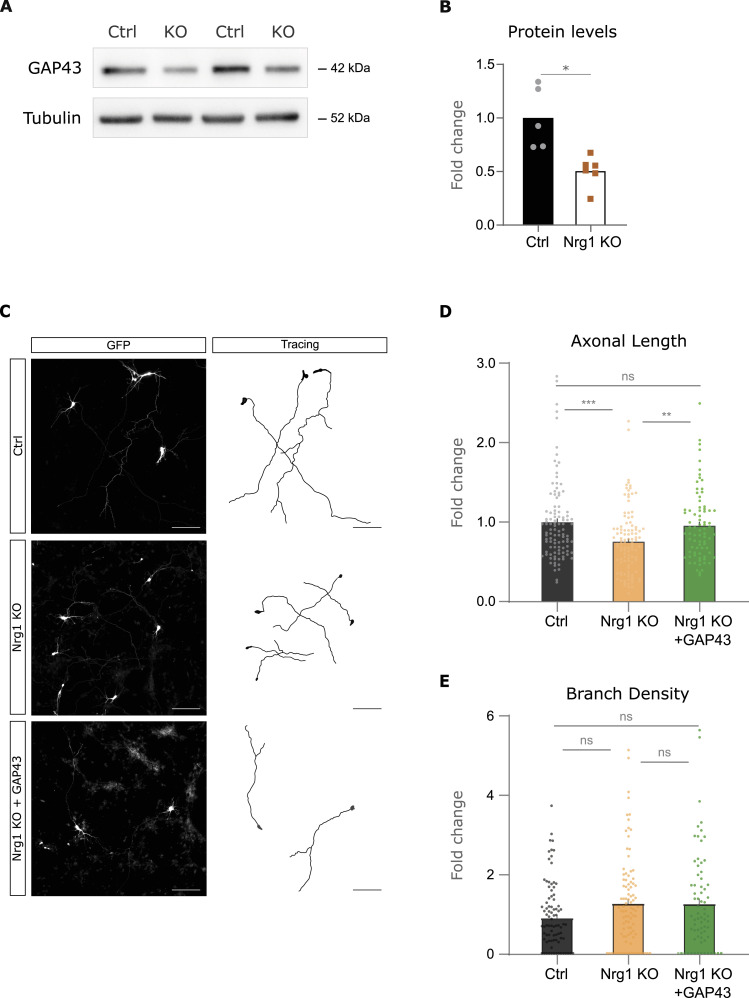
Figure 4. GAP43 expression is reduced by Nrg1 loss and rescues axonal growth in Nrg1-deficient neurons.
(A) Western blot (WB) analysis of GAP43 protein levels in control (Nrg1flox/flox) and Nrg1-deficient (Nes-Cre; Nrg1flox/flox) neurons at DIV4. Tubulin levels are shown as a loading control. (A, B) Quantification of GAP43 protein levels from (A). GAP43 protein levels are normalized to tubulin. Data are represented as the mean ± SEM. Statistical significance was determined using an unpaired t test with Welch’s correction. Ctrl: n = 6; Nrg1 KO: n = 5, mice, from two litters (*P < 0.05). (C) Representative images and corresponding tracings of immunofluorescence staining in control, Nrg1-deficient (Nrg1 KO), and Nrg1 KO neurons expressing GAP43 (Nrg1 KO+GAP43) at DIV4. Scale bar, 50 μm. (D) Quantification of axonal length in control, Nrg1 KO, and Nrg1 KO+GAP43 neurons. Data are represented as the mean ± SEM. Statistical significance was determined using a one-way ANOVA test with Tukey’s post hoc test. Ctrl: n = 104; Nrg1 KO: n = 105; GAP43: n = 78, neurons from two independent experiments (**P < 0.01, ***P < 0.001). (E) Quantification of branch density in control, Nrg1 KO, and Nrg1 KO+GAP43 neurons. Data are represented as the mean ± SEM. Statistical significance was determined using a one-way ANOVA test with Tukey’s post hoc test. Ctrl: n = 93; Nrg1 KO: n = 98; GAP43: n = 73, neurons from two independent experiments. ns, not significant.

