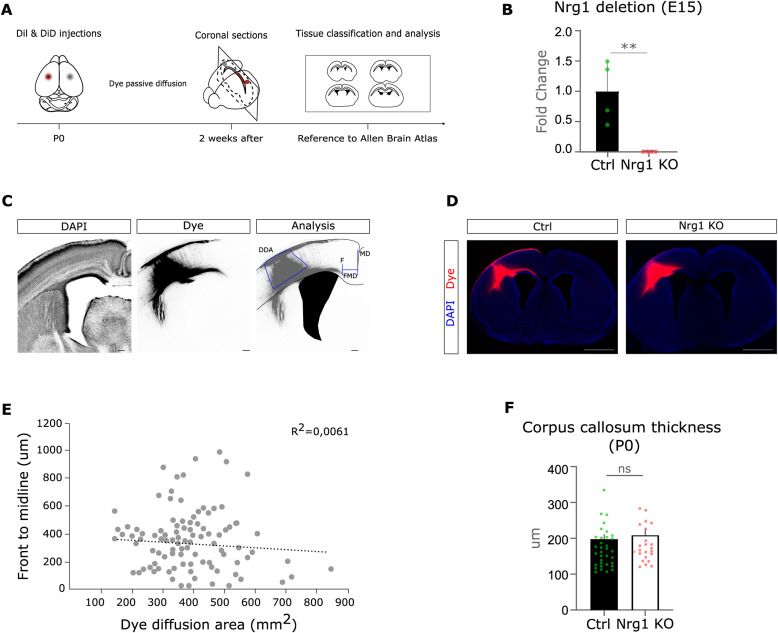
Figure S1. Characterization of the Nrg1 loss-of-function model in vivo.
(A) Schema of the experimental workflow. We performed two crystal dye injections (DiI and DiD) in the somatosensory cortices of both hemispheres of newborn Nrg1 KO mice. We let the dye to diffuse for 2 wk. After sectioning the brains, the slices were pictured and classified on a rostro-caudal axis. We took as reference the Allen Brain Atlas of Developing Mouse Brain at P1. (B) Graph shows the mRNA levels of Nrg1 in Nrg1 KO relative to control littermates quantified by qRT-PCR. Ctrl: n = 4; and Nrg1 KO: n = 4, littermates. **P < 0.01, unpaired t test. Average ± SEM. (C) Representative image of dye diffusion in our experimental settings. Schematic drawing of the analysis conducted: dye diffusion area, axonal front (F), midline (MD), and distance from the front to the midline. Scale bar, 100 μm. (D) Low magnification of the representative pictures from Ctrl and Nrg1 KO used in Fig 1. Scale bar, 1 mm. (E) Plot shows the lack of correlation between the diffusion of the dye and the position of the front of the callosal axons. We found no correlation between the two variables. n = 107; r = −0.08, Pearson’s correlation coefficient; R squared = 0.006. (F) Graph shows the quantification of the corpus callosum thickness in Ctrl and Nrg1 KO mice. We failed to find any major impairment in this parameter. Ctrl: n = 34 sections, out of eight brains; and Nrg1 KO: n = 23 sections, out of five brains, compared with its internal controls from three litters. P = 0.47, unpaired t test. ns, not significant. Average ± SEM.

