
Figure 2: Kaplan-Meier survival curves.
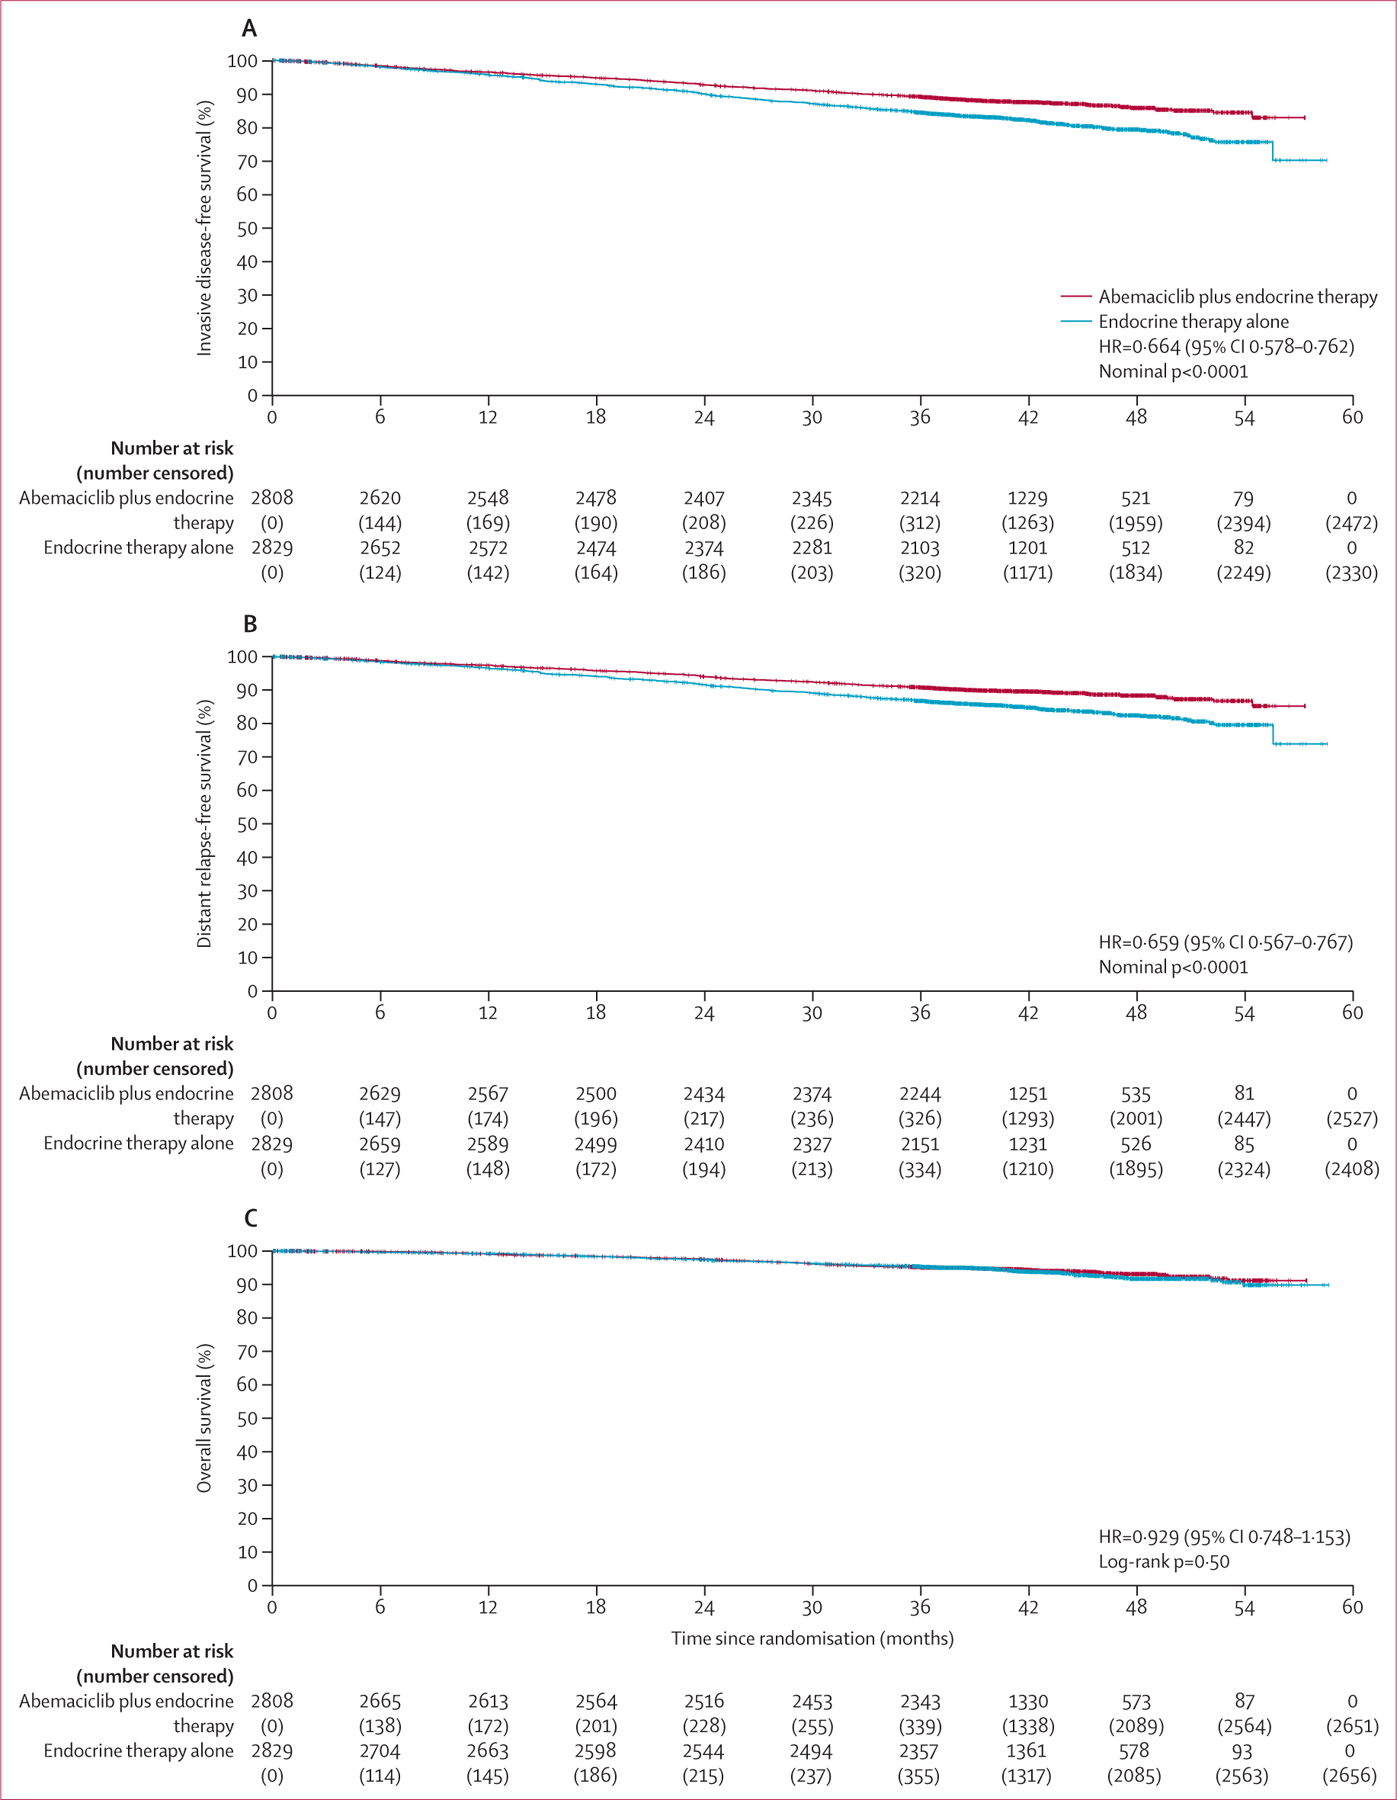
Invasive disease-free survival in the ITT population at the second overall survival interim analysis. (B) Distant relapse-free survival in the ITT population at the second overall survival interim analysis. (C) Overall survival in the ITT population at the second overall survival interim analysis. Vertical dashes denote censored patients. HR=hazard ratio. ITT=intention to treat.