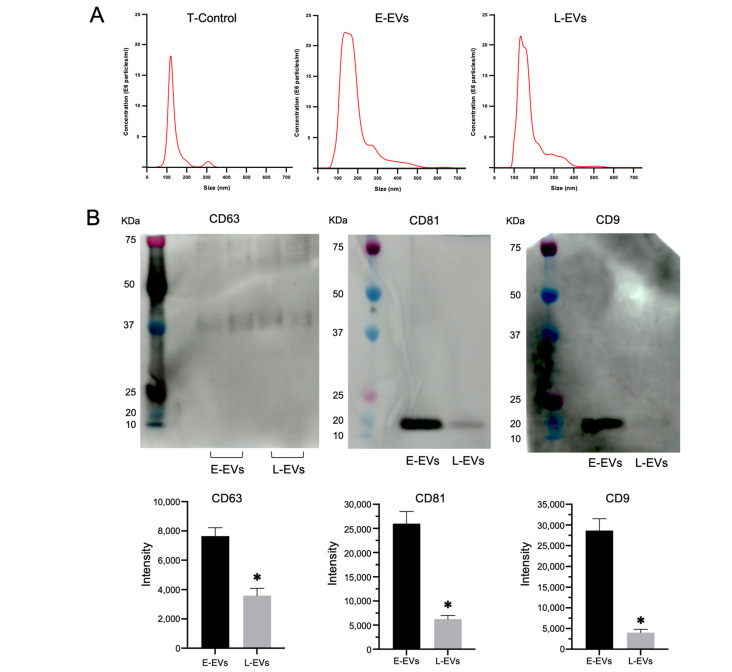
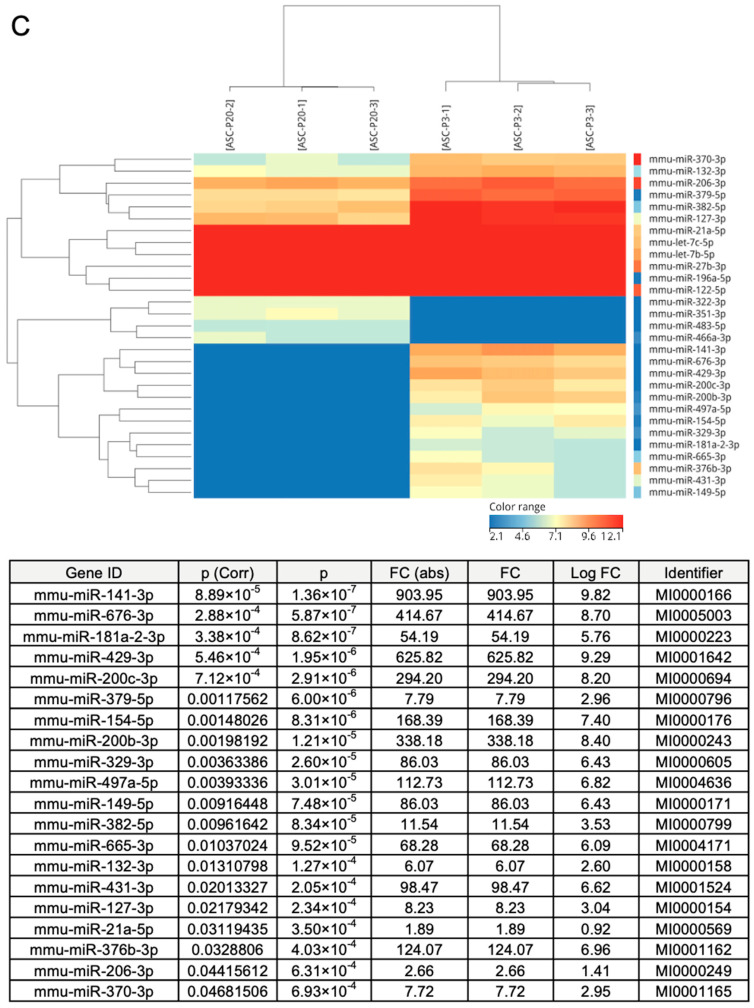
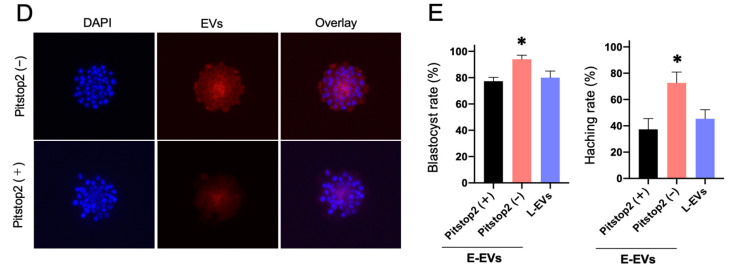
Figure 3.
(A) The NanoSight instrument indicates the concentration or size of nanoparticles in the lower chamber. T-Control: no cells in the upper chamber; E-ASCs (adipose tissue-derived mesenchymal stem cells): the early passage of ASCs (P3: 3rd passage) seeded in the upper chamber; L-ASCs: late passage of ASCs (P20: 20th passage) seeded in the upper chamber. (B) Detection of exosomal markers CD63, CD81, and CD9 in exosomes isolated from the supernatant of E-ASCs or L-ASCs determined by Western blotting. * p < 0.05 vs. E-EVs. (C) Expression analysis of miRNAs in E-EVs and L-EVs determined by Next-Generation Sequencing. (D) Fluorescence microscopy showing the E-EVs taken up by the blastocyst. Nuclei were counterstained with 4′,6-diamidino-2-phenylindole (DAPI). (E) Blastocyst formation and hatching rates of in vitro-produced mouse embryos with exosomes of E-ASCs (E-EVs) or exosomes of L-ASCs (L-EVs). E-ASC group with Pitstop2 (+) or without Pitstop2 (–). Data are presented as the mean ± standard error. * p < 0.01 vs. E-EVs with Pitstop2.


