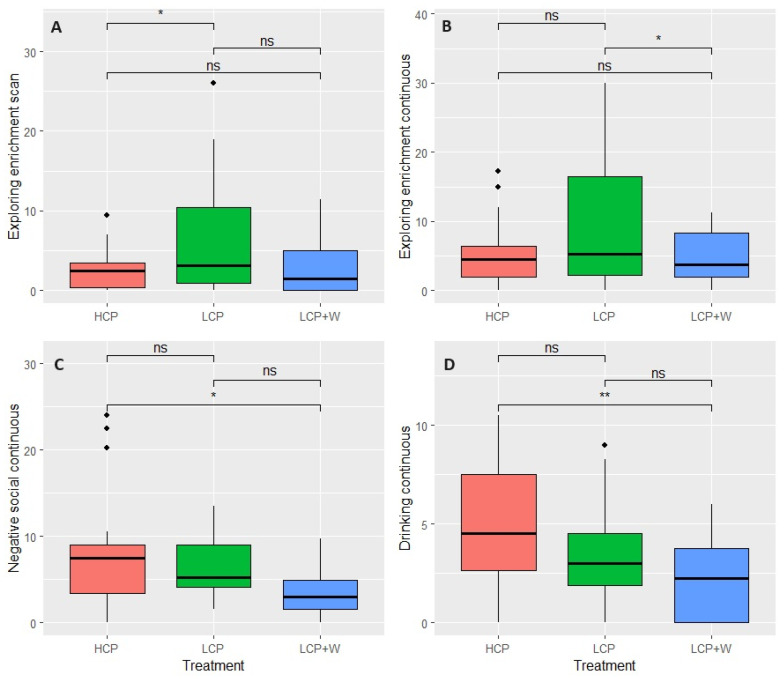
Figure 3.
Boxplots of the behaviour differences among diets. The plot shows only the behaviours with significant diet differences and their pairwise comparisons: exploring enrichment scan (A), exploring enrichment continuous (B), negative social continuous (C), and drinking continuous (D). p > 0.05 (ns); p < 0.05 (*); p < 0.001 (**).

