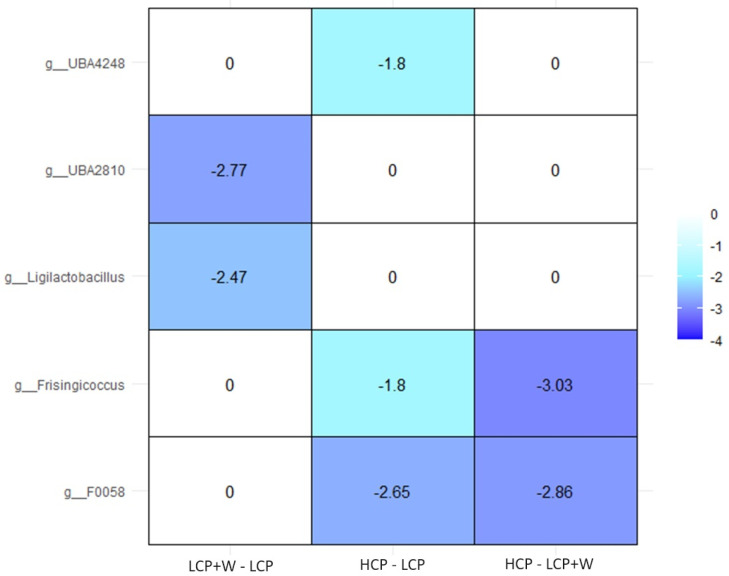
Figure 5.
Heatmap of ANCOM-BC2 pairwise analysis for the effect of the different diets. The X-axis represents the specific pairwise comparisons, and the Y-axis displays the significant genus identified by ANCOM -BC2. Each cell in the heatmap is colour-coded, with blue representing reduced abundance, white representing non-differences, and the numbers on each cell indicating the log fold change. The Holm-Bonferroni method was utilised to correct for multiple tests.

