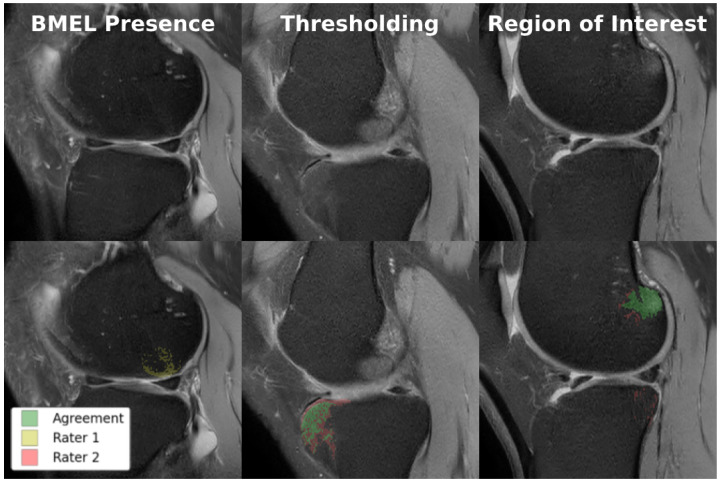
Figure 6.
Examples of disagreement between raters in BMEL annotation. Top row: original TSE images; bottom row: TSE images overlaid with two annotations, where green represents voxels of agreement and yellow and red represents voxels of disagreement. Lannotators disagreed on whether BMEL was present in the slice (left); annotators disagreed on the thresholding value used to determine which voxels within the region-of-interest constituted BMEL (center); annotators disagreed on the extent of the region-of-interest (right).

