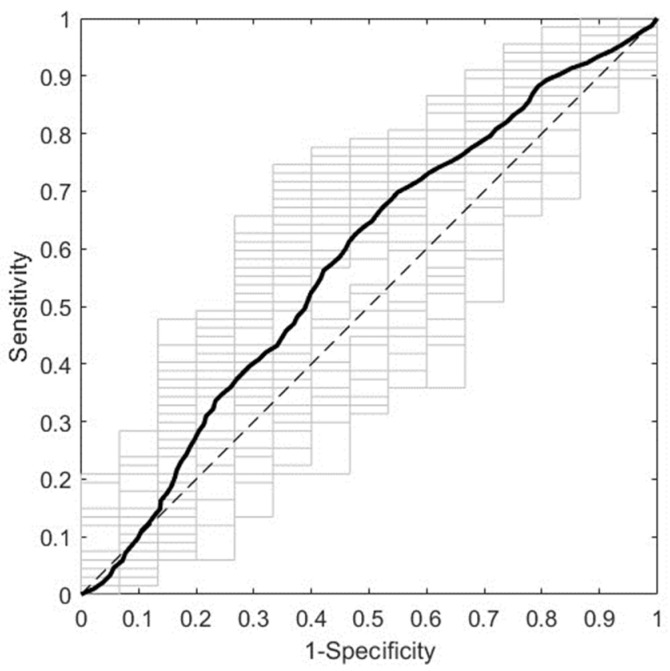
Figure 2.
ROC curve of the best predictive model for the first trimester cohort. The model was trained with NIR spectra (R1, 10,500–7600 cm−1) from first trimester serum samples after pretreatment by normalization and mean centering. The average and the individual curves of 50 DCV repetitions are colored in black and gray, respectively. ROC: receiver operating characteristic; NIR: near-infrared; R1: Range 1; DCV: double cross-validation.

