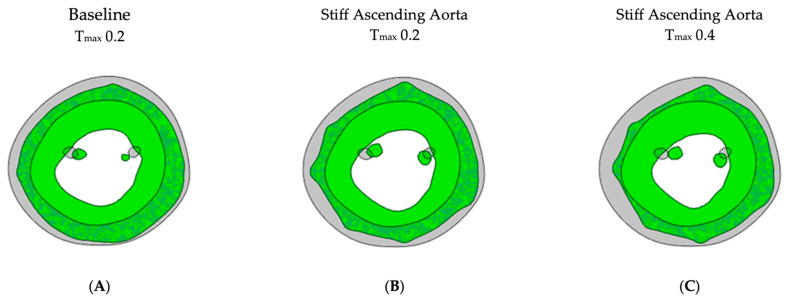
Figure 6.
Left ventricular cross-sectional profile. Cross-sectional profile of the LV at center of the longitudinal LV axis and base of the papillary muscles. Gray color shows the end-diastolic shape at baseline; green color shows the end-systolic shape. (A) Baseline Tmax 0.2, diameter 59 mm, (B) stiff AA Tmax 0.2, diameter 57 mm and (C) stiff AA Tmax 0.4, diameter 55 mm.

