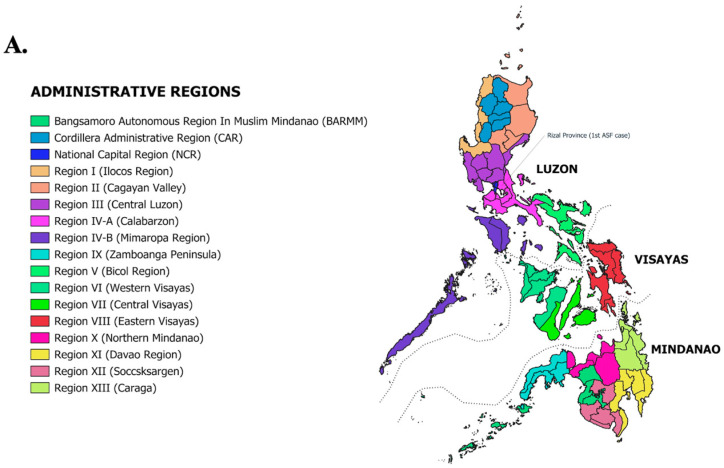
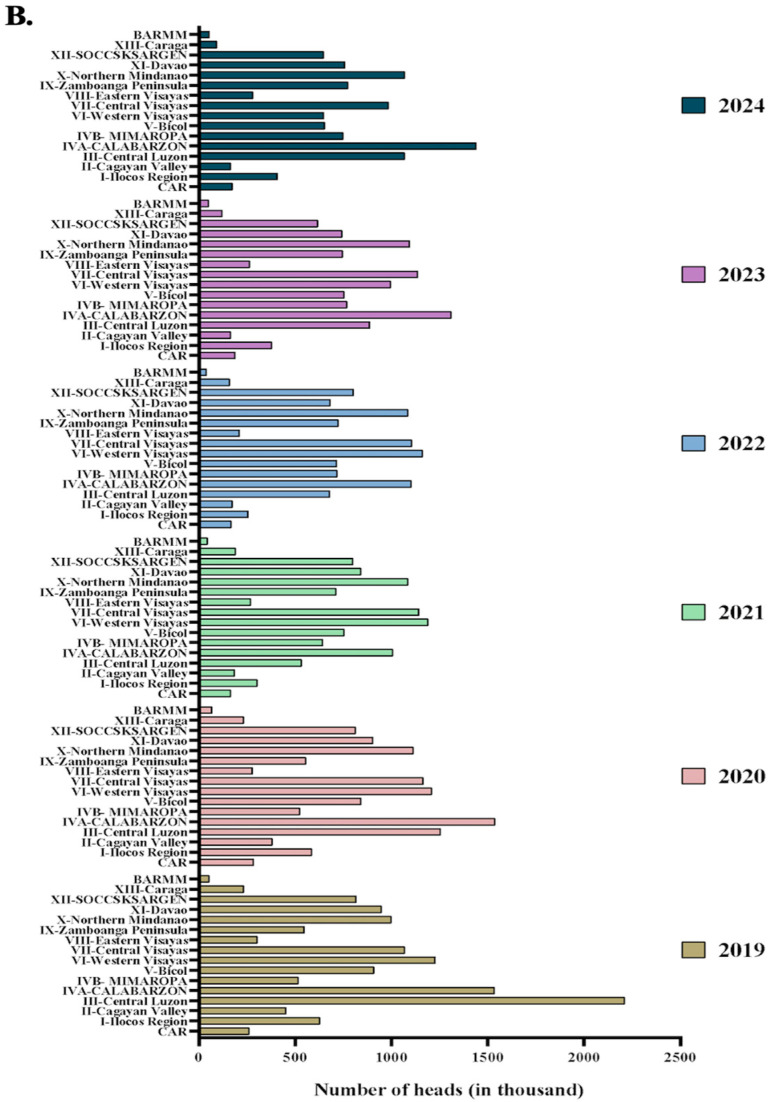
Figure 2.
Distribution of swine inventory per region from 2019 to 2022. (A) Map of the Philippines with its administrative regions. Map was created in QGIS version 3.30. (B) Values presented represent the total number of swine heads including small hold, semi-commercial, and commercial farms from each region at the time of report dates indicated. All data and values presented were retrieved from the Special Release of Swine Situation Report by the Philippines Statistics Authority (PSA) from their reports in 2019 (1 July 2019), 2020 (20 June 2020), 2021 (30 September 2021), 2022, 2023 and first quarter of 2024.


