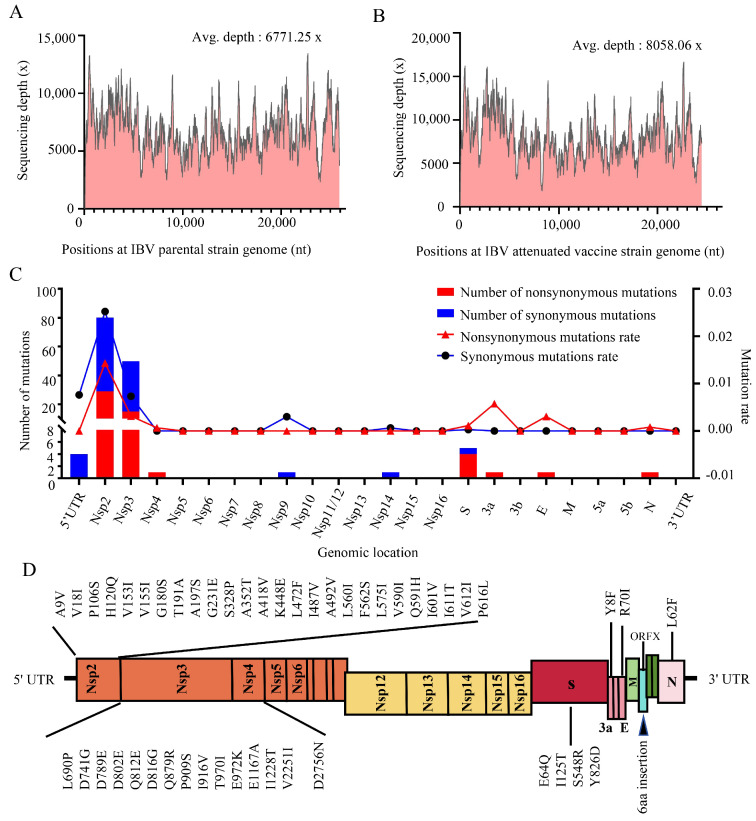
Figure 1.
Next-generation sequencing analysis of the parental and attenuated IBV strains. (A) Sequencing depth for the IBV parental strain. (B) Sequencing depth for the attenuated IBV strain. (C) Per genomic location with number and mutation rate of nonsynonymous and synonymous mutations. The bar graph illustrates the number of mutations at each genomic location, with blue bars representing synonymous mutations and red bars representing non-synonymous mutations. Meanwhile, the line graph shows the mutation rates for genes, with blue lines indicating synonymous mutation rates and red lines indicating non-synonymous mutation rates. (D) Distribution of amino acid mutations across the parental and attenuated strains of IBV.

