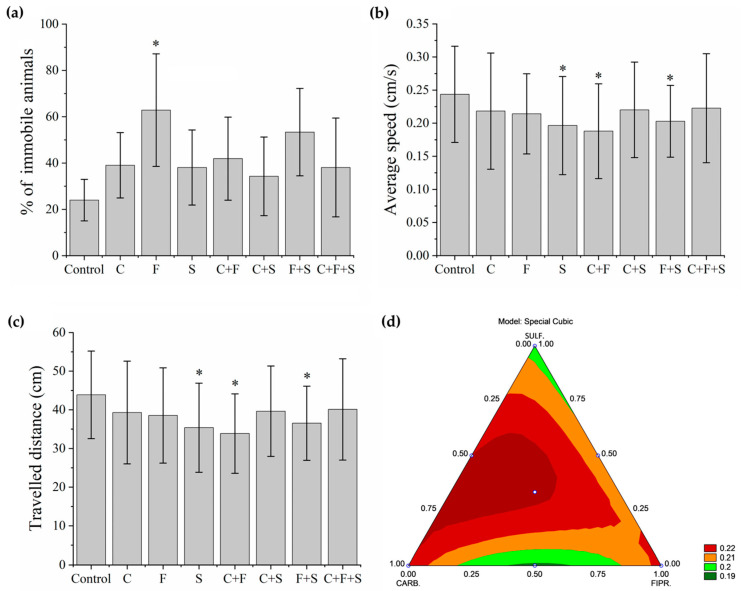
Figure 3.
Mean total percentage and SD of larvae that remained immobile during the Exploratory Activity test (a). Groups were compared to the control group using a one-way ANOVA (F (7,55) = 2. 71277, p < 0.01) followed by Tukey’s test (C p = 0.84; F p = 0.01; S p = 0.88; C + F p = 0.70; C + S p = 0.98; F + S p = 0.13; C + F + S p = 0.88), p < 0.05 (*). Mean Speed of larvae swimming during the test (b). Groups were compared to the control group using a one-way ANOVA (F (7,435) = 4.0053, p < 0.01) followed by Tukey’s test (C p = 0.44; F p = 0.37; S p = 0.002; C + F p < 0.05; C + S p = 0.52; F + S p = 0.03; C + F + S p = 0.67), p < 0.05 (*). Mean Total Distance traveled by larvae that swam during the test (c). Groups were compared to the control group using a one-way ANOVA (F (7,435) = 4. 00565, p < 0.01) followed by Tukey’s test (C p = 0.44; F p = 0.37; S p = 0.003; C + F p < 0.05; C + S p = 0.52; F + S p = 0.03; C + F + S p = 0.68), p < 0.05 (*). (d) Ternary contour plot of the variables Carbendazim, Fipronil, and Sulfentrazone for a special cubic model (F (3,380) = 3.004, p = 0.03), evaluating the individual effects and interactions of these pesticides in their mixtures. Carbendazim and Sulfentrazone were more toxic by reducing the total distance traveled (green areas). Key: Contr—Control; C—Carbendazim; F—Fipronil; S—Sulfentrazone.

