Figure 9.
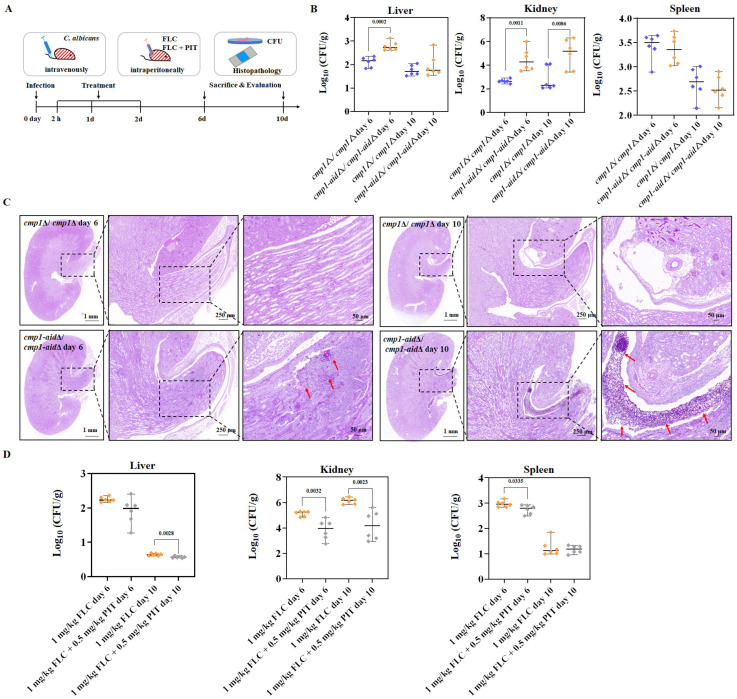
PIT enhances the antifungal activity of FLC against C. albicans in vivo. (A) Schematic overview of the timeline for the systemic candidiasis model. (B) CFUs analysis of infected liver, kidney, and spleen tissues after being infected for 6 or 10 days. C57BL/6 mice were intravenously infected with cmp1Δ/cmp1Δ (no FLC tolerance) and cmp1-aidΔ/cmp1-aidΔ (high FLC tolerance). FLC was administered at 1 mg/kg intraperitoneally once daily and lasted three days. CFUs were normalized to tissue weight (n = 6). p values were calculated using two-tailed unpaired t-tests. (C) Histopathology analysis of infected kidney tissues after 6 or 10 days of infection. Infected kidney tissues were stained with Periodic Acid-Schiff (PAS) and examined under ×1, ×3, and ×10 lenses (Scale bar = 1 mm, 250 μm, and 50 μm). Stained fungal cells are indicated with red arrows. Data were obtained from three independent experiments, and representative images are shown. (D) CFUs analysis of infected liver, kidney, and spleen tissues after 6 or 10 days of infection. C57BL/6 mice were intravenously infected with cmp1-aidΔ/cmp1-aidΔ. All values are CFUs recovered from tissue homogenates after 3 days of treatment. FLC was administered at 1 mg/kg and PIT at 0.5 mg/kg intraperitoneally once daily. CFUs were normalized to tissue weight (n = 6). p values were calculated using two-tailed unpaired t-tests.

