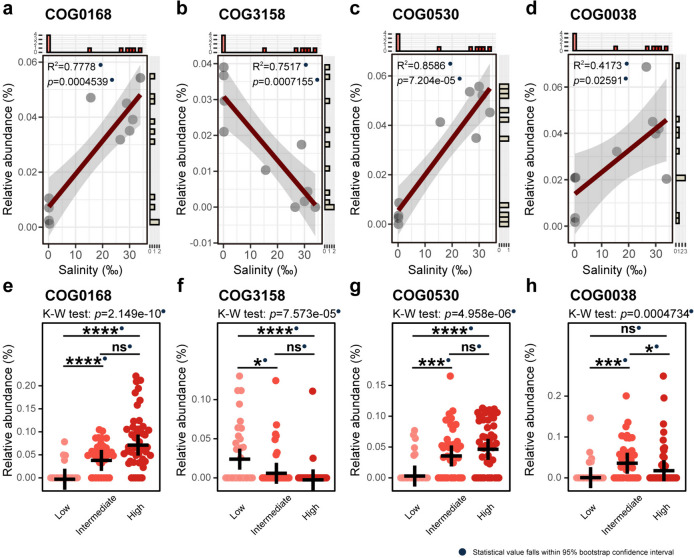
Fig. 4.
Relative abundances of the SIR COGs in metagenomes and stenohaline MAGs. a–d Relative abundance trends of COG0168, COG3158, COG0530, and COG0038 at the metagenome level. The regression R-squared values and p values are embedded within the graphs. e–h Relative abundances of the four SIR COGs in stenohaline MAGs. All R-squared values and p values fall within the 95% confidence interval of bootstrap tests and are marked with solid blue dots. Number of MAGs involved in statistical calculations: low-salinity category, n = 33; intermediate-salinity category, n = 36; high-salinity category, n = 44. The crosses in the figures indicate the mean relative abundances. Statistical significance symbols: ****p ≤ 0.0001, ***p ≤ 0.001, **p ≤ 0.01, *p ≤ 0.05, ns p > 0.05 (Kruskal–Wallis rank-sum test with Dunn’s multiple comparison test). Source data are provided in Additional file 2: Supplementary Tables S9 and S10

