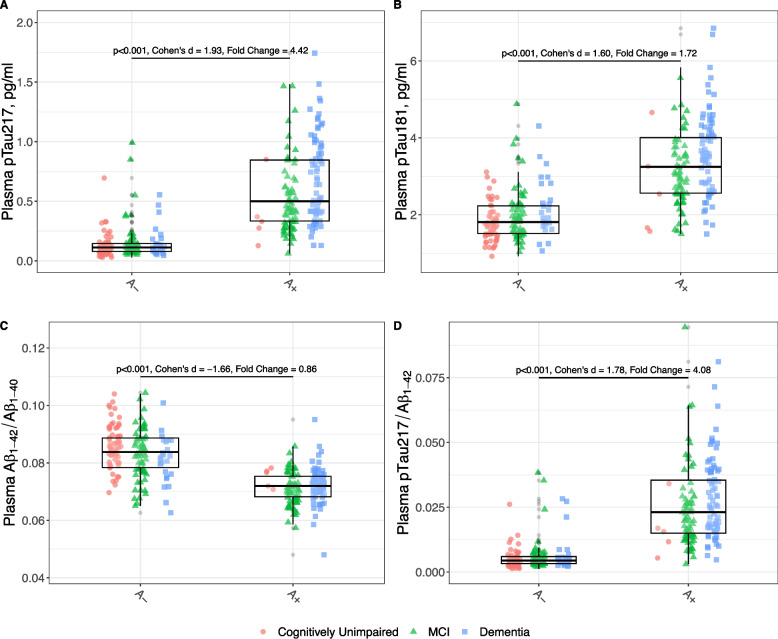
Fig. 1.
Levels of plasma biomarkers and their ratios according to the A status in CSF. All p-values are derived from multivariate linear model, adjusted for the effects of age, sex, APOE ε4 status, chronic kidney disease stage, vascular risk factors and clinical stage. For better visualization, two outliers exceeding 2 pg/mL were excluded from the pTau217 boxplot for the A + group in the dementia stages. Not adjusted by other variables effect sizes are shown (Cohen’s d). Plasma biomarkers Cohen’s d and Fold Change calculated in log-transformed data. pTau217: phosphorylated tau 217, pTau181: phosphorylated tau 181. Aβ1–42: Amyloid β1–42. Aβ1–40: Amyloid β1–40. MCI: Mild cognitive impairment

