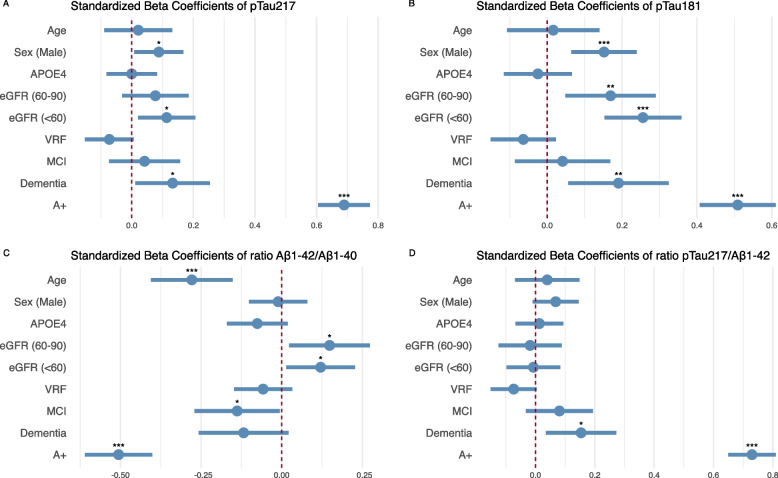
Fig. 2.
Effect of different variables on plasma pTau217, pTau181, Aβ1–42/Aβ1–40 and pTau217/ Aβ1–42. Dots and bars represent the standardized beta coefficients of each variable in a multivariate regression model. Lines represent the 95% confidence interval for each standardized beta coefficient. Red vertical dashed lines indicate a null effect. We can see the effect size of A positivity adjusted by other variables. pTau217: phosphorylated tau 217. pTau181: phosphorylated tau 181. Aβ1–42: Amyloid β1–42. Aβ1–40: Amyloid β1–40. MCI: mild cognitive impairment. VRF: vascular risk factors. eGFR: estimated glomerular filtration rate

