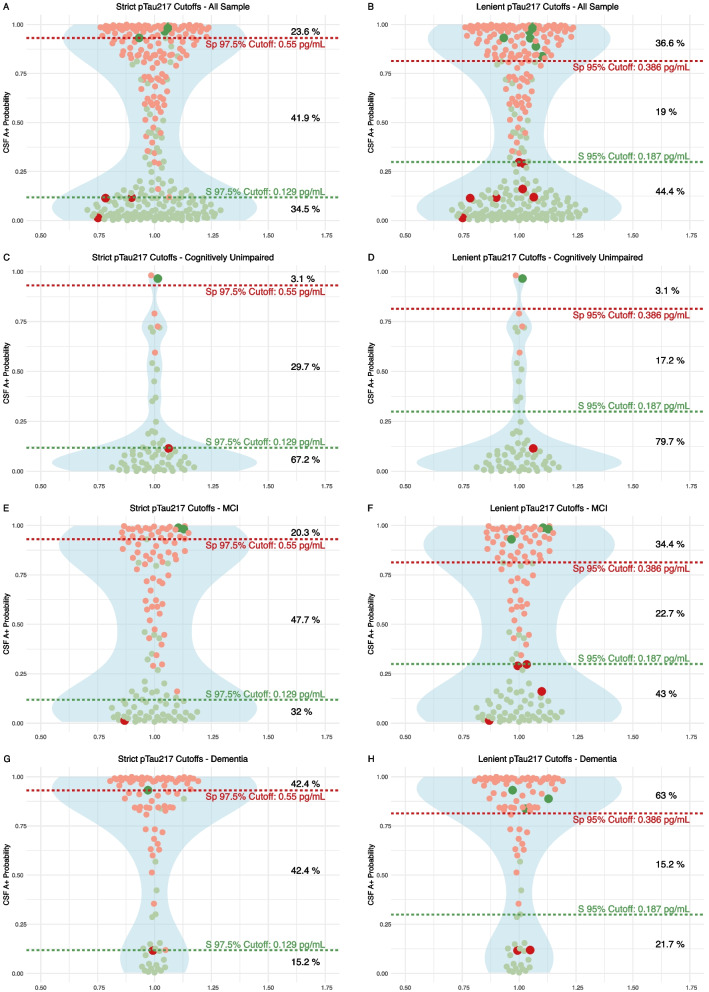
Fig. 4.
Plasma pTau217 predictive models. Strict and lenient cutoffs in the whole sample and in the distinct clinical groups. We illustrate the implementation of various cutoff thresholds within our sample, denoted by dashed lines in red and green at distinct Y-axis levels, each line representing the associated sensitivity and specificity values. Displayed in red dots are individuals with amyloid positivity in cerebrospinal fluid (CSF) and in green those amyloid negatives. Those participants with pTau217 concentrations above dashed red lines are classified as high risk of amyloid CSF positivity. The medium risk category is between dashed red and green lines. Below dashed green line are the participants classified as low risk. Observations that have been incorrectly categorized into high or low risk groups are represented by distinct sizes and colors. To the right, the corresponding percentages of the sample assigned to each risk category are presented. pTau217: phosphorylated tau 217, pTau181: phosphorylated tau 181. Aβ1–42: Amyloid β1–42. Aβ1–40: Amyloid β1–40. Model 1 included only plasma pTau217 for predictions. S, sensitivity. Sp, specificity

