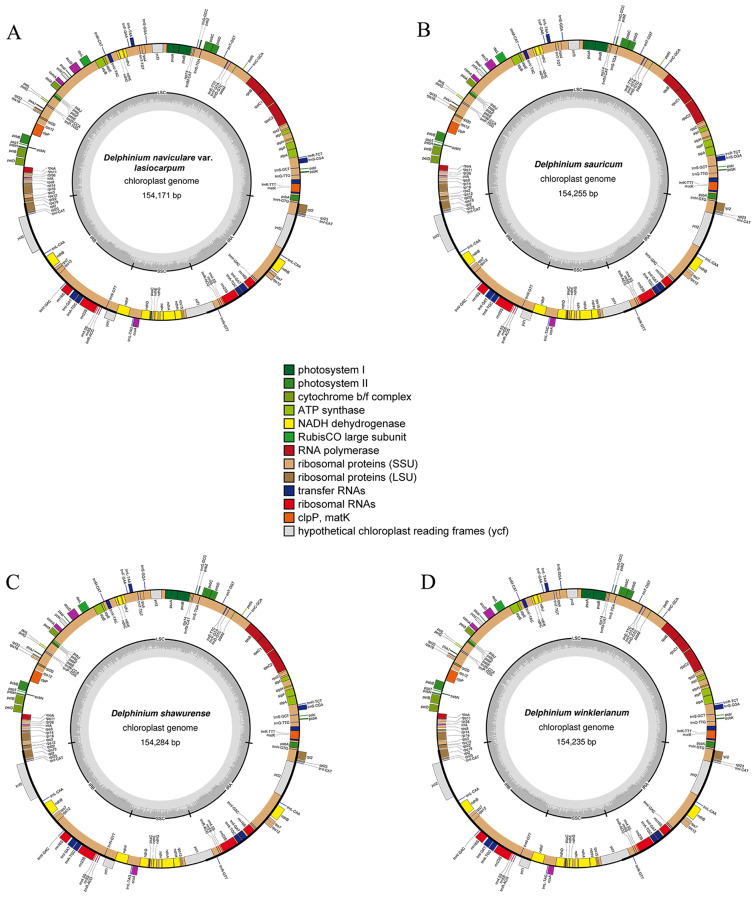
Fig. 2.
Plastomes of four Delphinium taxa, including D. naviculare var. lasiocarpum, D. sauricum, D. shawurense and D. winklerianum. The outer circle shows the genes at each locus, and inverted repeat regions are indicated with thicker lines. Genes on the outside of the outer circle are transcribed in a counterclockwise direction, while genes on the inside of the outer circle are transcribed in a clockwise direction. The inner circle indicates the range of the large single-copy (LSC), small single-copy (SSC), and the inverted repeats (IRs), and also shows a GC content graph of the genome. In the GC content graph, the dark gray lines indicate GC content, while light gray lines indicate the AT content at each locus

