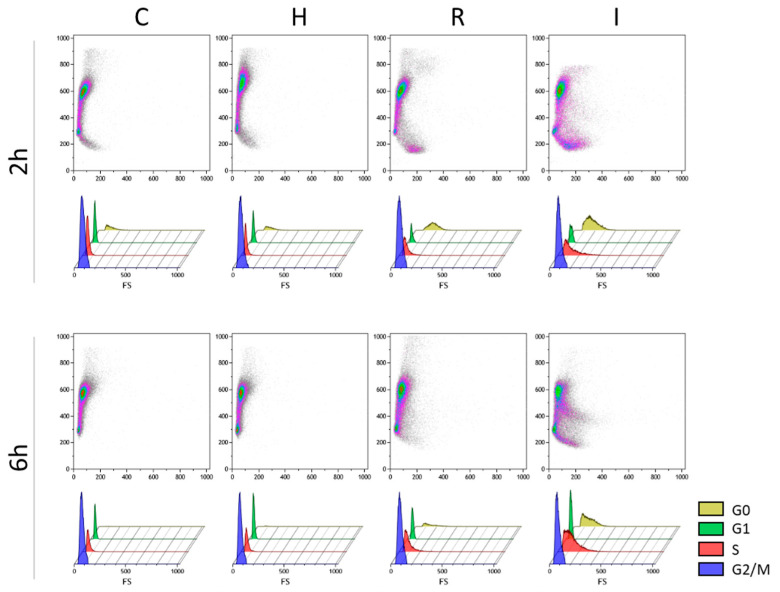
Figure 3.
Bidimensional flow cytometric analysis of the early response of the four growth conditions (C, H, R, and I). In the three-dimensional dot plots of each panel, the green fluorescence (FL1-A, x-axis) and forward scatter signal (FSC-A, y-axis) results are presented, representing cell size and DNA content per cell, respectively. Relative amounts of cells in G0, G1, S, and G2/M cell cycle stages are depicted in the bottom rows for each time.

