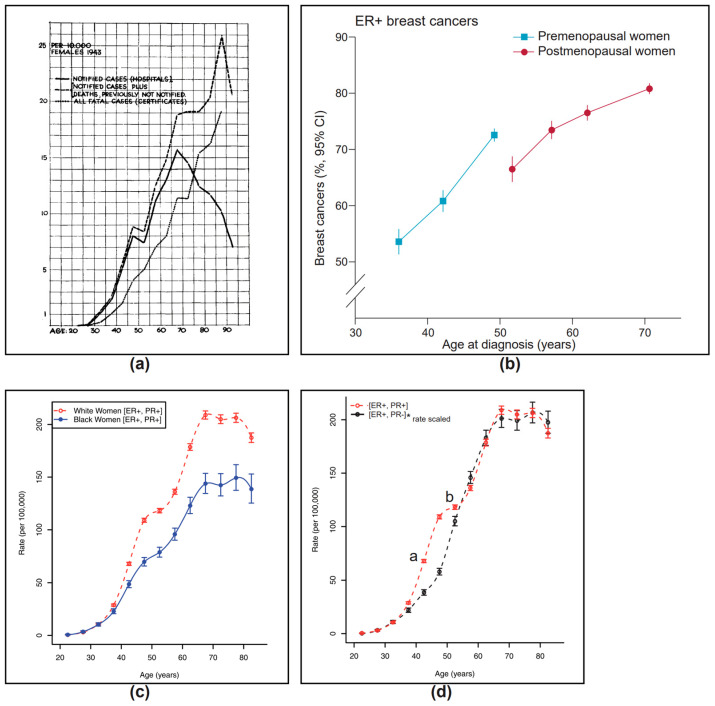
Figure 2.
Epidemiology of breast cancer. (a) Hospital cases of cancer mammae according to age when first seen in hospital from the Danish Cancer Registry 1942–1944. Reprinted [38] (Figure 2) License Order Number: 5775001136853 from the Oxford University Press and the Copyright Clearance Center. (b) Breast cancer by tumor characteristics and by women’s age and menopausal status, estrogen receptor-positive. Reprinted [39] (Figure 6), under Creative Commons License CC BY. Modified by cropping. (c) Age-specific incidence rates by breast cancer phenotype in black and white women. Reprinted [40] (p. 5, Figure 3A) under Creative Commons Attribution License. Modified by cropping. (d) Comparison of age-specific incidence rates for ER+PR+ and ER+PR- breast cancers in white women. ER+PR+ breast cancers show an earlier rise than ER+PR- cancers during the early menopausal transition (indicated by “a”) and then level off (indicated by “b”) in the late menopausal transition before resuming the steady linear increase with age exhibited by the ER+PR- breast cancers. Reprinted [40] (Figure 3A,B) under Creative Commons Attribution License. Modified by *rate-scaling the ER+PR- curve so that the y-axis maximums are the same for both ER+PR+ and ER+PR- curves, cropping and superimposition of [40] (Figure 3A,B).

