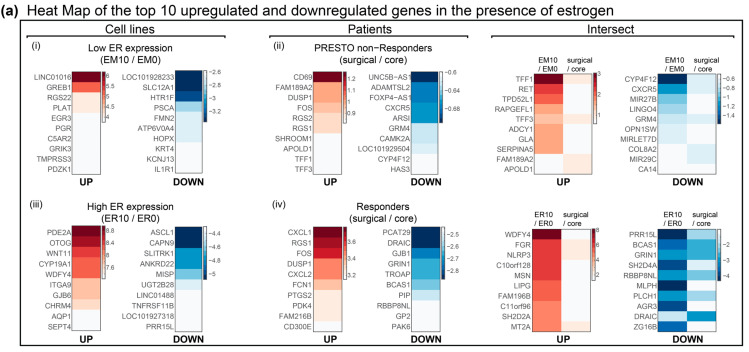
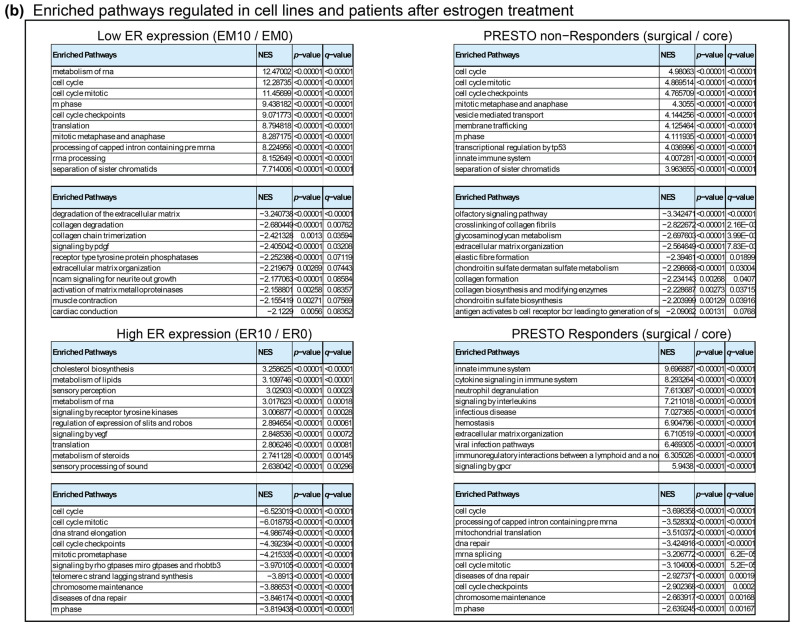
Figure A1.
(a) Heatmaps highlighting top 10 upregulated, downregulated and intersect genes (common to both pairs) upon estrogen treatment in patients and cell lines. Color bars indicate log2 fold change. (b) Tables of top 10 enriched pathways (Reactome gene set, scored using Gene Set Enrichment Analysis) regulated in cell lines and patients after estrogen treatment. For each pathway, the p-value, false discovery rate q-value and the normalized enrichment scores (positive and negative) are indicated.


