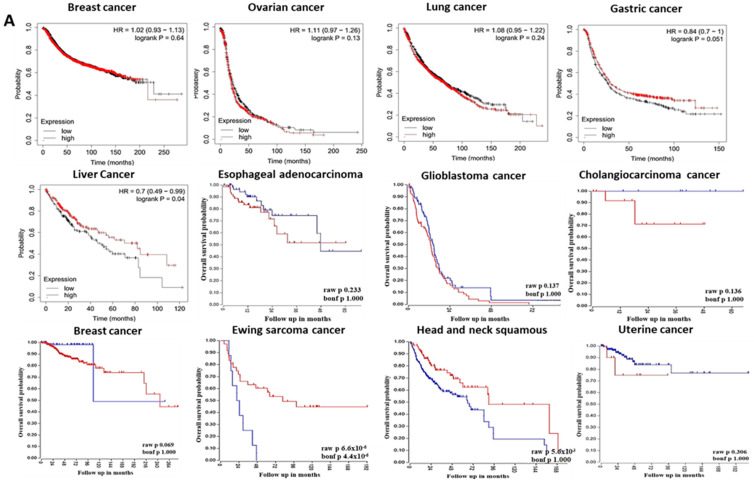
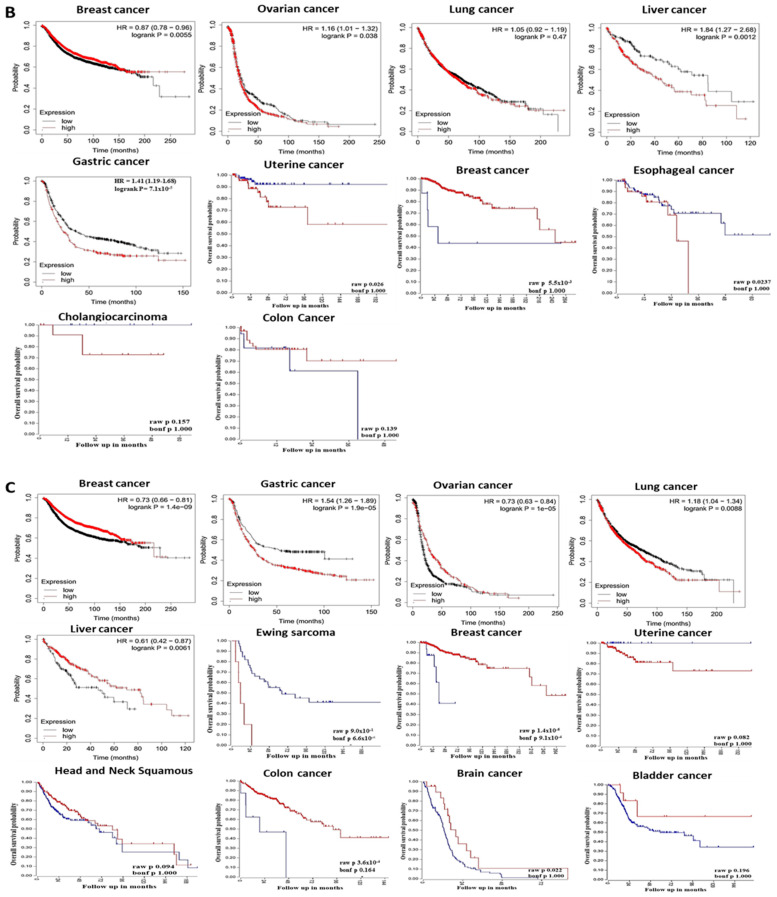
Figure 2.
Correlation of PHLDA1, PHLDA2, and PHLDA3 expression with the prognosis of various cancers. (A). Correlation of PHLDA1 expression with the prognosis of various cancers (R2: Kaplan-Meier Scanner; Kaplan-Meier Plotter). Patients with high (red) and low (blue) PHLDA1 expression were compared on survival curves using breast, ovarian, lung, gastric, and liver data from Kaplan-Meier Plotter; esophageal cancer, brain, cholangiocarcinoma, breast, Ewing sarcoma, head, and neck squamous, uterine data from R2: Kaplan-Meier Scanner. Cox p-value threshold < 0.05. For PHLDA1, gene expression was not statistically significant for breast, ovarian, lung, esophageal, glioblastoma, cholangiocarcinoma, head and neck squamous, and uterine cancer (B). Correlation of PHLDA2 expression with the prognosis of various cancers (R2: Kaplan–Meier Scanner; Kaplan-Meier Plotter). Survival curves comparing patients with high (red) and low (blue) PHLDA2 expression were plotted using breast, ovarian, lung, liver, and gastric data from Kaplan-Meier Plotter; uterine cancer, breast, esophageal, cholangiocarcinoma, and colon cancer data from R2: Kaplan–Meier Scanner. Cox p-value threshold < 0.05. For PHLDA2, gene expression was not statistically significant for cholangiocarcinoma and colon cancer (C). Correlation of PHLDA3 expression with the prognosis of various cancers (R2: Kaplan-Meier Scanner, Kaplan-Meier Plotter). Survival curves comparing patients with high (red) and low (blue) PHLDA3 expression were plotted using breast, gastric, ovarian, lung, and liver data from Kaplan-Meier Plotter; Ewing sarcoma cancer, breast, uterine, head, and neck squamous, colon, brain cancer, and bladder data from R2: Kaplan-Meier Scanner. p < 0.05 represents statistical significance. For PHLDA3, gene expression was not statistically significant for lung, liver, and head and neck squamous cancer.


