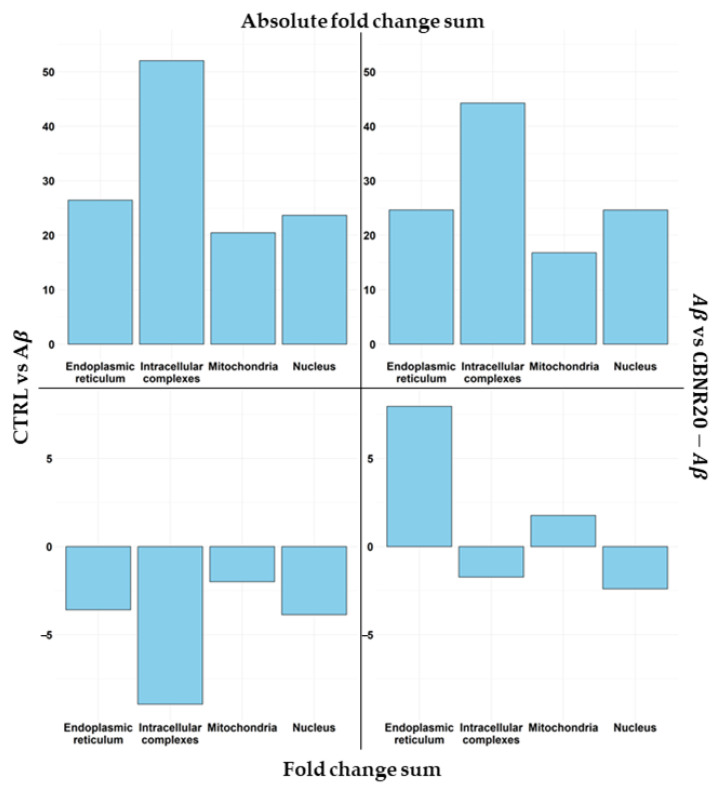
Figure 4.
Comparison of DEG regulation among the main subcellular structures. Each plot shows the sum of the fold change for each DEG included in the structure for the CTRL vs. Aβ (left frames) against the Aβ vs. CBNR20-Aβ (right frames) analyses. In the top frames, the sum of the absolute fold change is highlighted, so it is possible to observe how much CBNR is able to regulate the structures. On the other hand, the bottom frames highlight the sum of the positive or negative fold change, showing if the structure is upregulated or downregulated overall.

