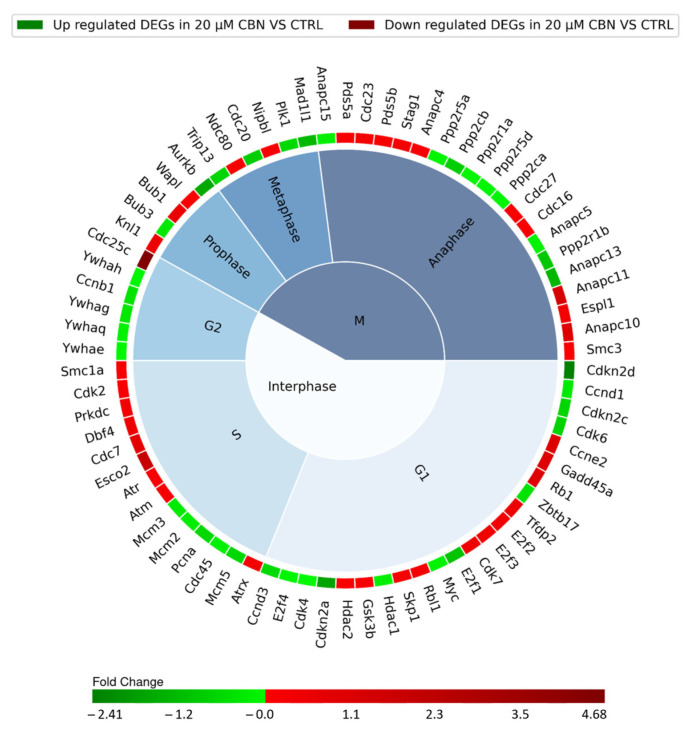
Figure 5.
Nested pie chart represents the DEGs in cell cycle KEGG pathway (mmu04110), resulting from the comparison of 20 µM CBN-treated cells vs. CTRL. The chart is divided into the different phases of the cell cycle, and the DEGs were associated with a specific phase using Uniprot. The red boxes indicate the upregulated genes, and the green ones the downregulated genes. A color map of the fold changes for each DEG indicates the magnitude of differential expression for each gene (schematically reported in Table S2).

