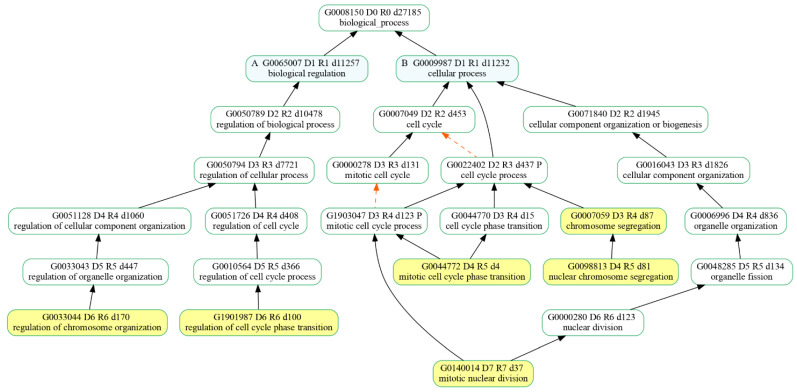
Figure 6.
Hierarchy of the selected biological processes (highlighted in yellow) that were enriched in our comparative expression analysis of 20 µM CBN-treated samples vs. control ones. “is_a” relationship is specified by solid black arrows while “part_of” relationship is indicated by red dash arrows.

