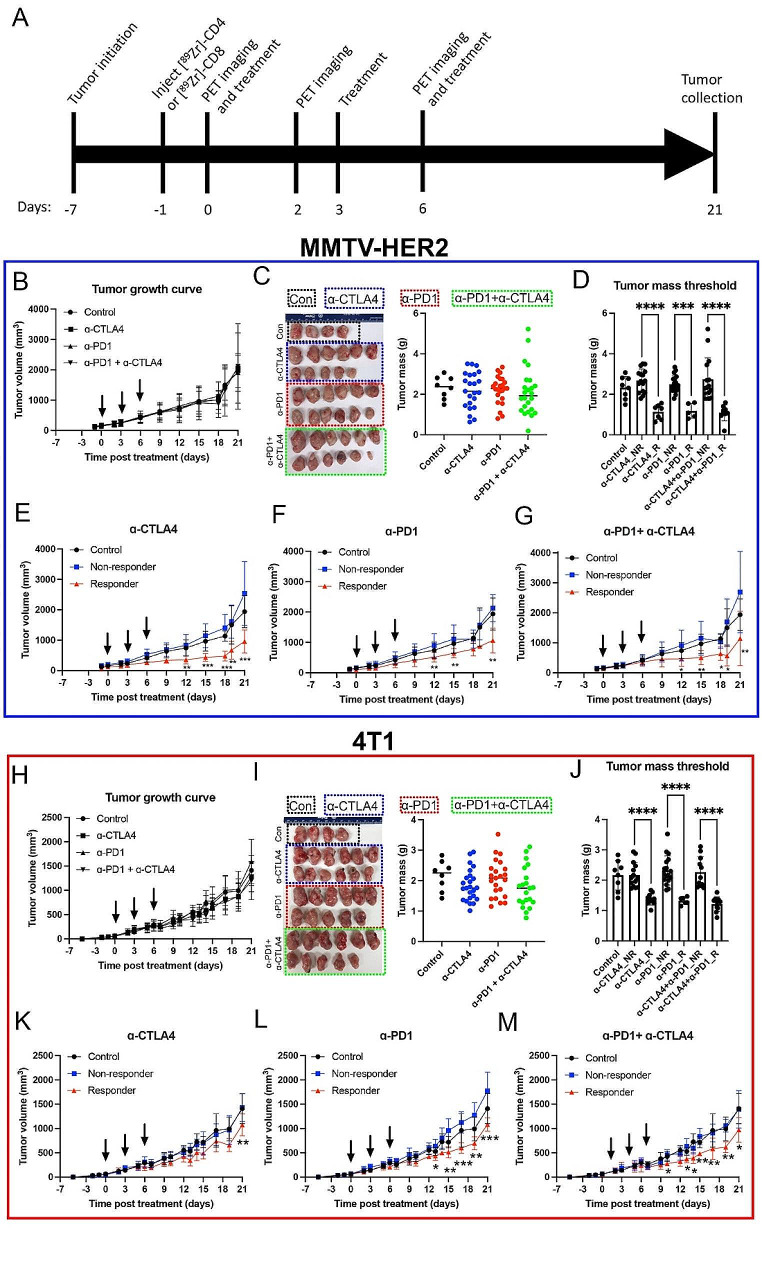
Fig. 1.
ICB treatment response varies in MMTV-HER2 and 4T1 mouse models. A) Experimental timeline. B) Tumor growth curve of MMTV-HER2 model. C) Image of tumors at the end of the experiment in the MMTV-HER2 model. The combinational treatment group showed a trend of decrease in tumor mass, yet the decrease was not significant. D) Tumor mass of threshold method in MMTV-HER2 model. E-F) Tumor growth curve after thresholding in MMTV-HER2 model. Responders showed significantly decreased tumor volumes. H) Tumor growth curve of 4T1 model. I) Image of tumors at the end of the experiment in the 4T1 model. J) Tumor mass of threshold method in the 4T1 model. K-M) Tumor growth curve after thresholding in the 4T1 model. N = 80. R was for responders. NR was for non-responders

