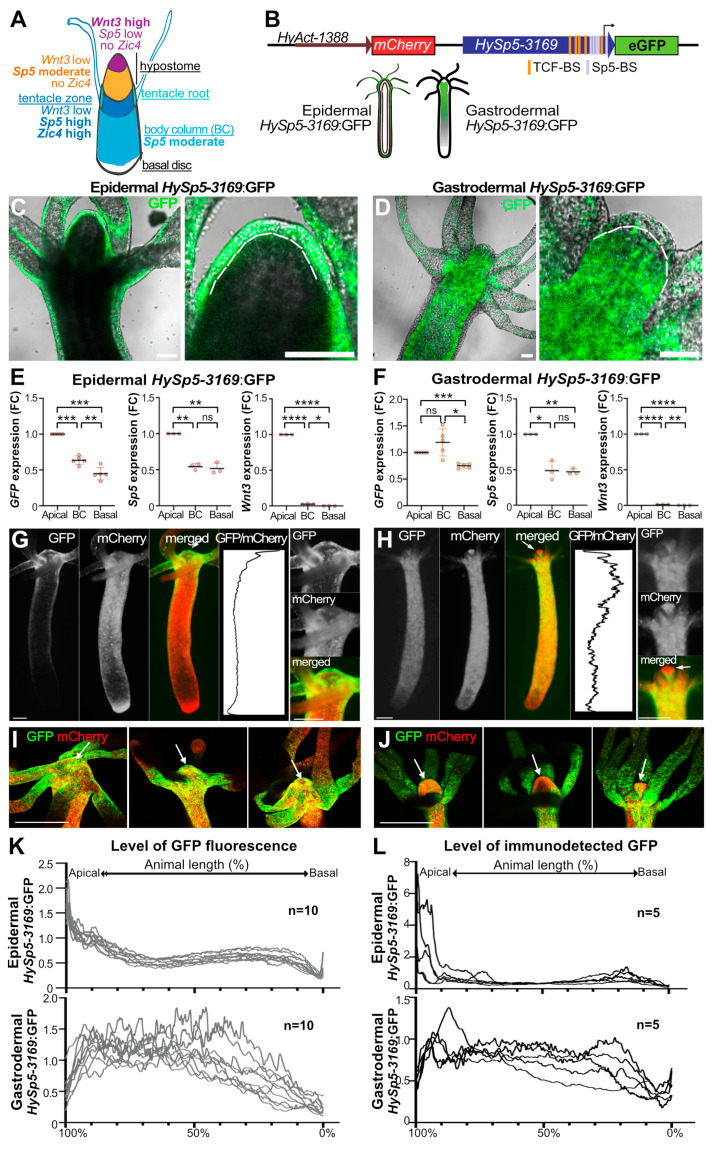
Figure 1.
Differential regulation of HySp5-3169:GFP expression in the epidermal and gastrodermal layers. (A) Schematized view of Hydra anatomy that includes the apical region or head, formed from a dome-shape named hypostome, centered around the oral opening, surrounded by a ring of tentacles at its basis, the elongated or contracted body column and the basal disc or foot that can attach to substrates. The respective expression levels of Wnt3, Sp5 and Zic4 define three distinct domains in the apical region (see ref. [34]). (B) Structure of the HyAct-1388:mCherry_HySp5-3169:GFP reporter construct used to generate the epidermal and gastrodermal HySp5-3169:GFP transgenic lines, where epithelial cells from the epidermis and gastrodermis, respectively, express GFP and mCherry (sequence in Figure S2). TCF-BS: TCF-binding sites (orange); Sp5-BS: Sp5-binding sites (grey). (C,D) Optical sections of live transgenic animals expressing HySp5-3169:GFP in the epidermis (C) and gastrodermis (D). Brightfield and eGFP channels are shown and the apical region of each animal is magnified on the right (Figure S3A,B). The dashed white line indicates the thin extracellular layer known as the mesoglea, which delimits the epidermal (outer) and gastrodermal (inner) epithelial layers. Scale bar: 100 µm. (E,F) Q-PCR analysis of GFP, Sp5 and Wnt3 transcript levels in the apical, body column (BC) and basal regions of epidermal (E) and gastrodermal (F) HySp5-3169:GFP animals fixed immediately after dissection. p values as indicated in Materials & Methods. (G,H) Live imaging of epidermal (G) and gastrodermal (H) HySp5-3169:GFP animals with eGFP (green), mCherry (red); the apical region of each animal is magnified on the right. White arrows point to the tip of the hypostome. The graphs show the eGFP/mCherry fluorescence intensity ratios (relative GFP intensity) along the animal axis. (I,J) Immunodetection of GFP (green) and mCherry (red) in the apical region (white arrow) of epidermal (I) and gastrodermal (J) HySp5-3169:GFP animals. Scale bars in panels (G–J): 250 µm. (K,L) Graphs showing the relative GFP fluorescence recorded live (K) or after immunodetection (L) in epidermal or gastrodermal HySp5-3169:GFP animals. The apical extremity is on the left (100%), the basal one on the right (0%). See Figure S4.

