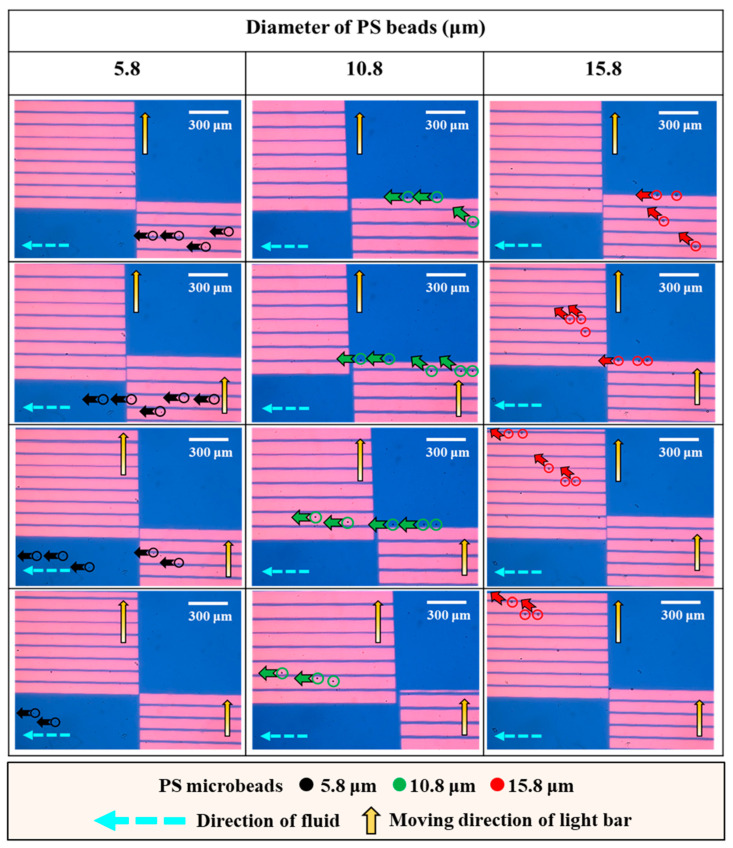
Figure 4.
Microscopic photographs showing the movement of PS microbeads (as indicated by black, green, and red arrows for 5.8, 10.8, and 15.8 μm PS microbeads, respectively) of the same size when they traveled through dynamic light bar arrays I and II. The process of moving through the course is shown in a top-down direction for each microbead size.

