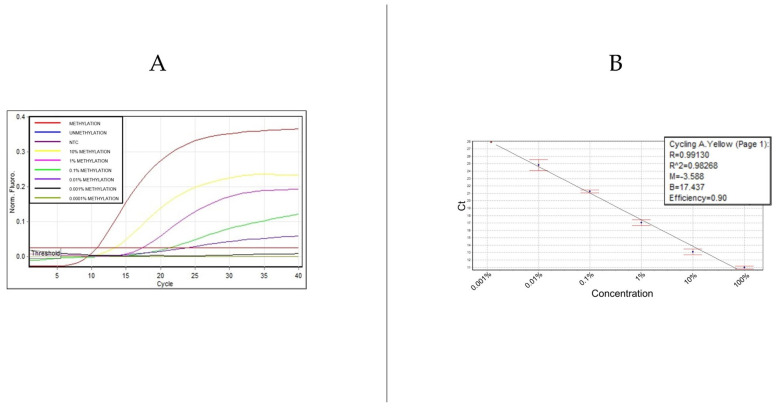
Figure 2.
Amplification signals and standard curve analysis for SHOX2 methylation detection. (A) illustrates amplification curves for SHOX2 methylation levels from 100% down to 0.01%. Below 0.01%, amplification signals are detectable in one of two replicates. (B) presents the standard curve, displaying a linear relationship across a dynamic range of four logs, with a coefficient of determination (R2 = 0.98268) and an amplification efficiency of 0.90.

