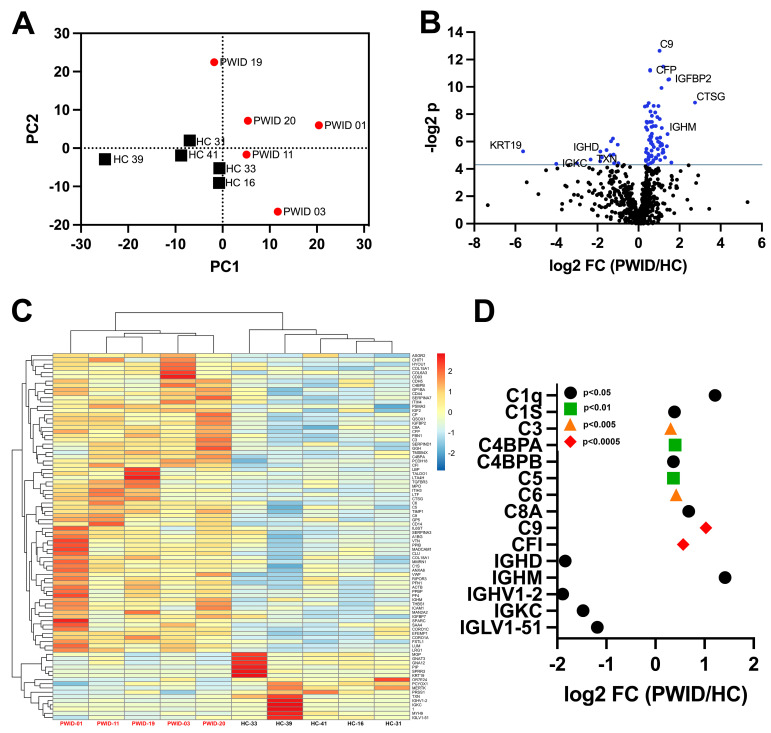
Figure 1.
Distinct plasma proteome of PWID. Plasma from PWID (n = 5) and HC (n = 5) was analyzed by DIA-MS. (A) PCA of plasma profiles based on all measured proteins (n = 666). (B) Identification of significantly differentially expressed proteins, blue indicates p < 0.05. (C) Relative expression of all differentially expressed proteins. (D) Fold-change (log2FC) of select complement and immunoglobulin-related differentially expressed proteins.

