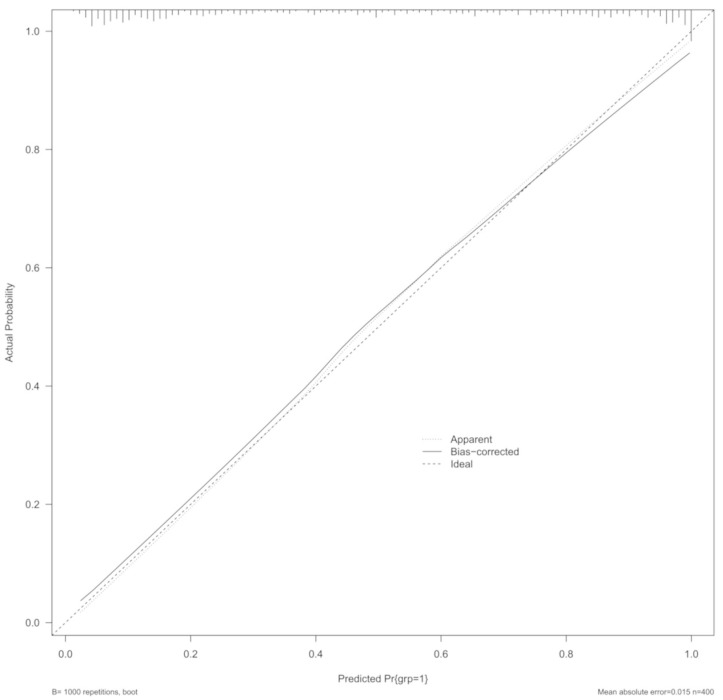
Figure 1.
Calibration plot of the final model using bootstrap internal validity resampling method, randomly sampling 100 returnable cases. The lateral axis shows the predicted probability of stroke for each patient, while the vertical axis shows the actual probability of stroke for each patient. It is ideal if the straight line exactly coincides with the dotted line.

