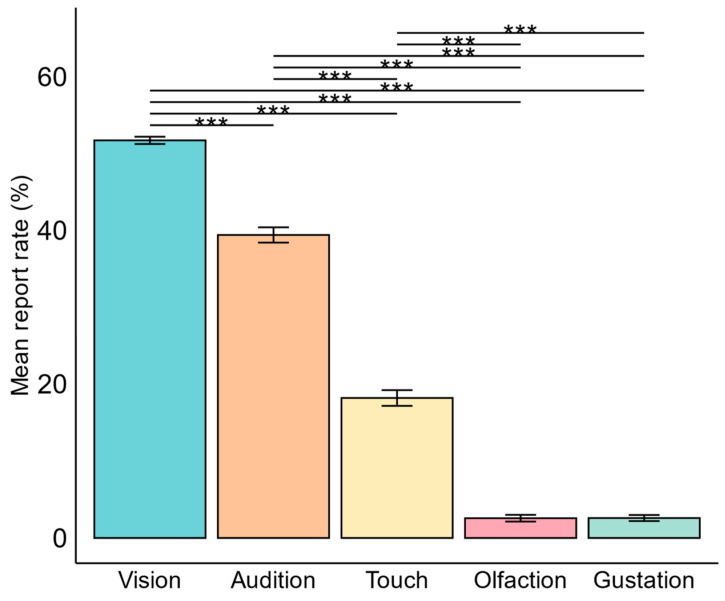
Figure 2.
Comparison of the prevalence of sensory dream experiences. In analyzing the prevalence of sensory dream experiences, vision emerged as the most frequent sensation compared to all other senses (p < 0.001). Audition followed as the second most prevalent sensation, surpassing touch, olfaction, and gustation (p < 0.001). Touch ranked third in prevalence, exceeding olfaction, and gustation (p < 0.001). Olfaction and gustation exhibited equally low rates of occurrence (p > 0.05). The mean report rate percentage was calculated in two steps: first, the percentage of dreams containing the sensory dream experience was calculated over all reports per participant, and then this percentage was averaged across all participants. Error bars represent standard deviation. *** = p < 0.001.

