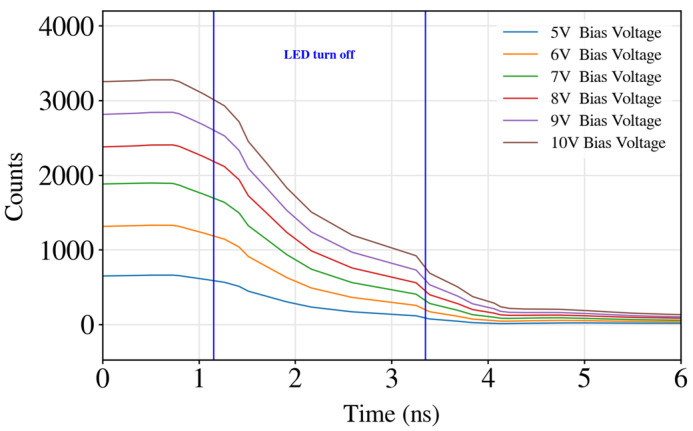
Figure 4.
Driving circuit turning off a microLED for different bias voltages. It can be observed that the turn off time is the same for all the bias voltage, therefore making the circuit speed robust to changes in the driving voltage of the LEDs. The y axis (Counts) represents the optical intensity captured by the SPAD sensor.

