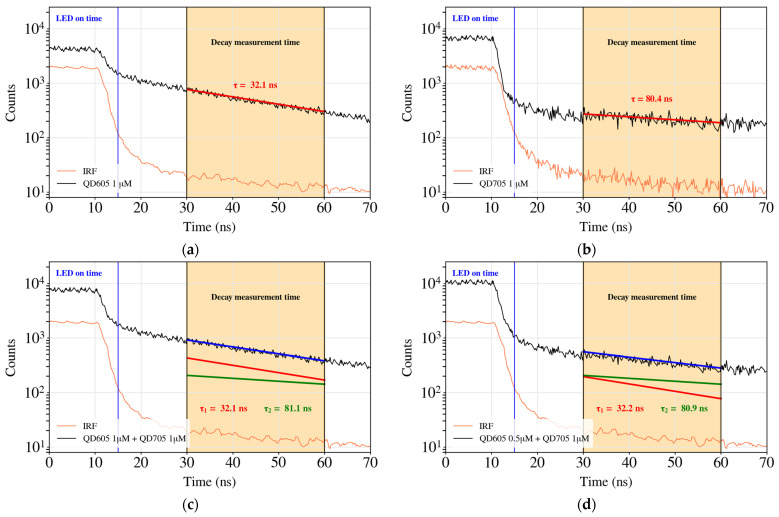
Figure 8.
Decay time for QD605 at a concentration of 1 µM (a) (with A = 1953 and τ = 32.1 ns) and for QD705 also at a concentration of 1 µM (b) (with A = 306 and τ = 80.4 ns). In both cases, it is shown the fitted line (in red) where the amplitudes (A) and the lifetimes (τ) are obtained. (c,d) correspond to a mixture of QD605/QD705 in ratio 1 µM/1 µM and 0.5 µM/1 µM, respectively. Bi-exponential fitting results in A1 = 1915 and τ1 = 32.1 ns; A2 = 417 and τ2 = 81.1 ns in (c) and A1 = 989 and τ1 = 32.2 ns; A2 = 397 and τ2 = 80.9 ns in (d).

