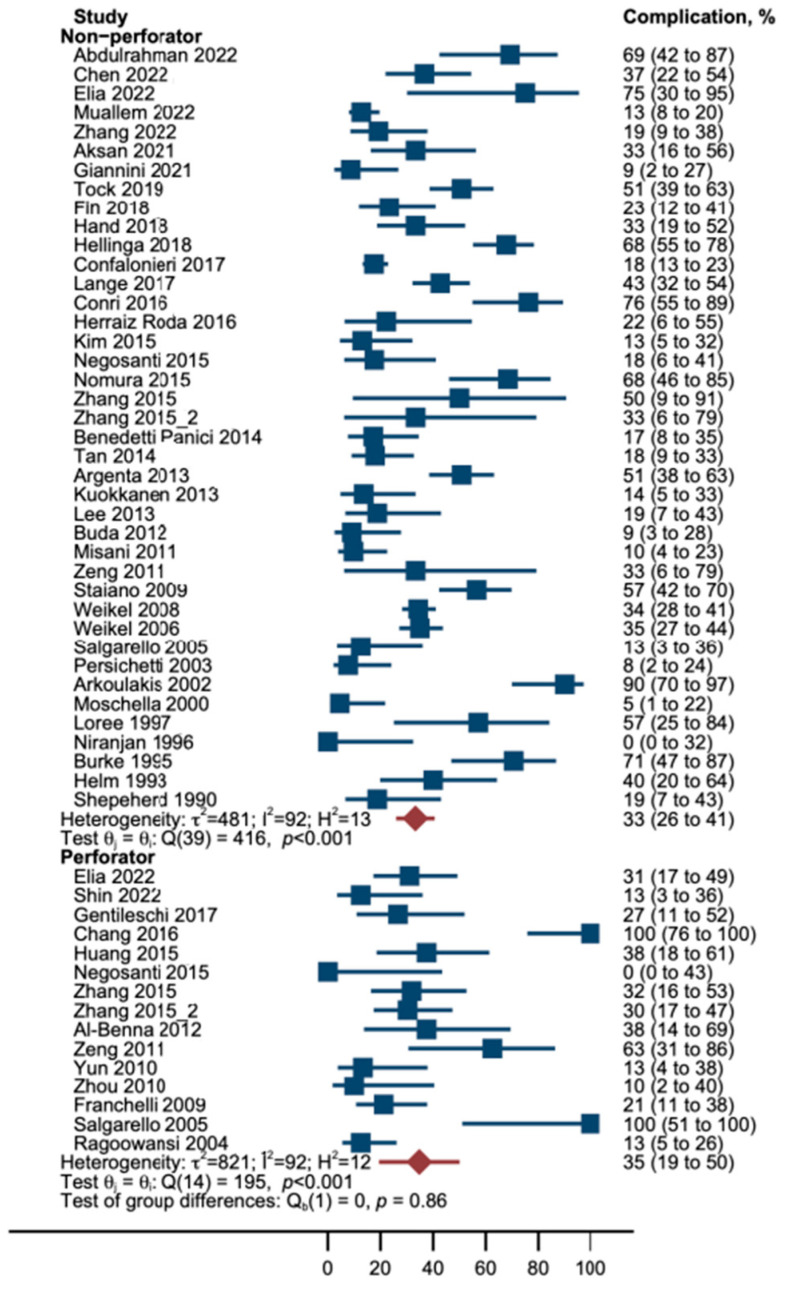
Figure 7.
Forest plot of sensitivity analysis 2: Association of treatment and proportion (blue boxes) of complications. Note that confidence intervals of proportions (horizontal lines) are asymmetrical because we used Wilson’s method for calculation of interval boundaries to account for small samples and few events. Red diamonds and lines represent pooled proportions with Wilson CI [9,10,20,21,22,23,24,25,26,27,28,29,30,31,32,33,34,35,36,37,38,39,40,41,42,43,44,45,46,47,48,49,50,51,52,53,54,55,56,57,58,59,60,61,62,63,64,65,66].

