Figure 5.

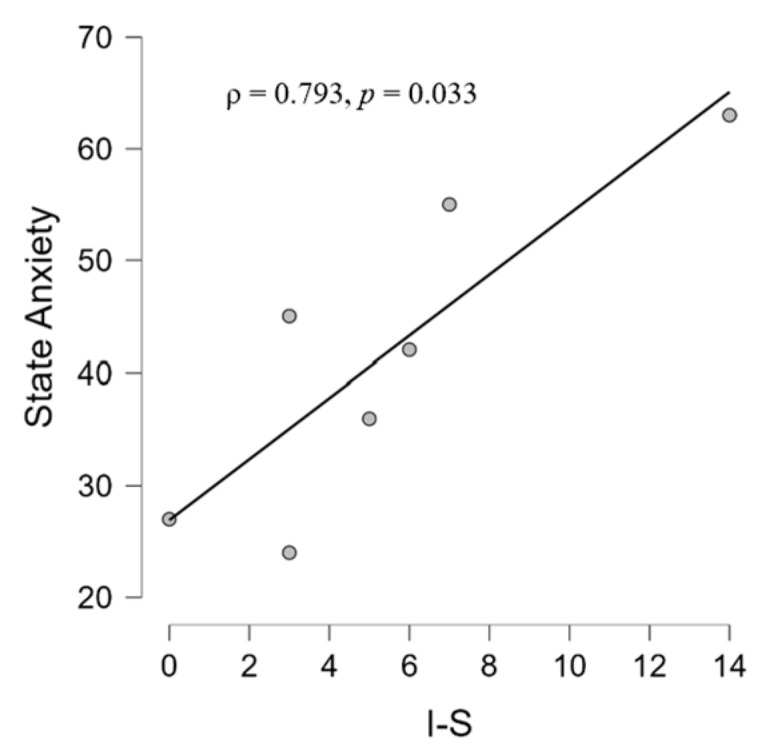
Scatter plot showing in the CONT group a positive correlation between interpersonal sensitivity (I-S) scale and state anxiety scale scores according to STAI-Y and SCL-90-R questionnaires, respectively.

Scatter plot showing in the CONT group a positive correlation between interpersonal sensitivity (I-S) scale and state anxiety scale scores according to STAI-Y and SCL-90-R questionnaires, respectively.