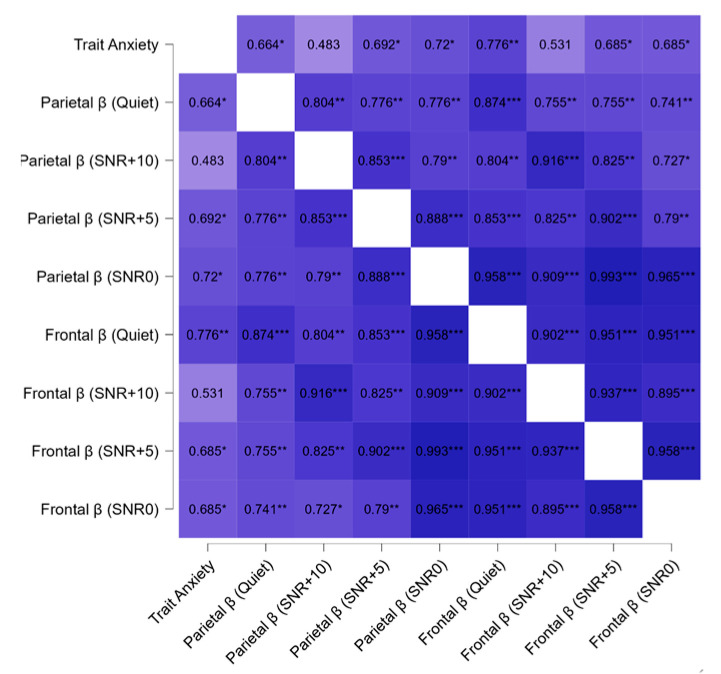
Figure 7.
Heatmap of correlation coefficient among trait anxiety scores and beta (β) activity in frontal and parietal area during audio cognitive stimulation phase at different SNR levels (quiet, +5, +10, +0) in the TIN group. Spearman’s correlations (* p ≤ 0.05; ** p ≤ 0.01; *** p ≤ 0.001) are shown between the variables described.

