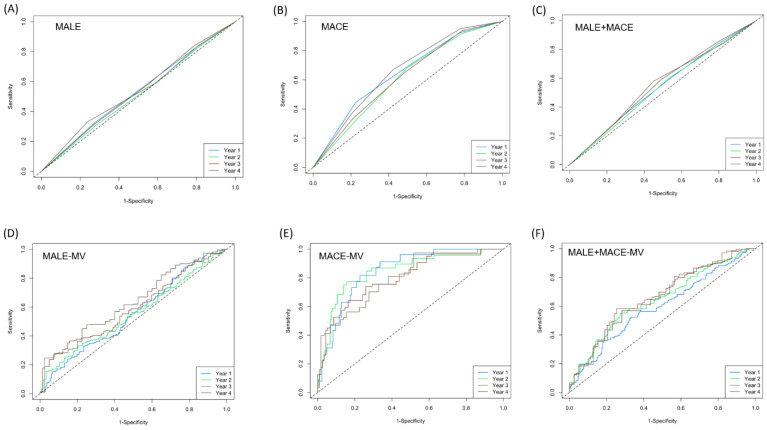
Figure 5.
ROC plots for 12 months, 24 months, 36 months, and 48 months using univariate models and multivariate adjusted models with CHA2DS2-VASc as the predictor. (A–C) Univariate models for MALEs, MACEs, and MALEs + MACEs, respectively. (D–F) Multivariate adjusted models for MALEs, MACEs, and MALEs + MACEs, respectively.

