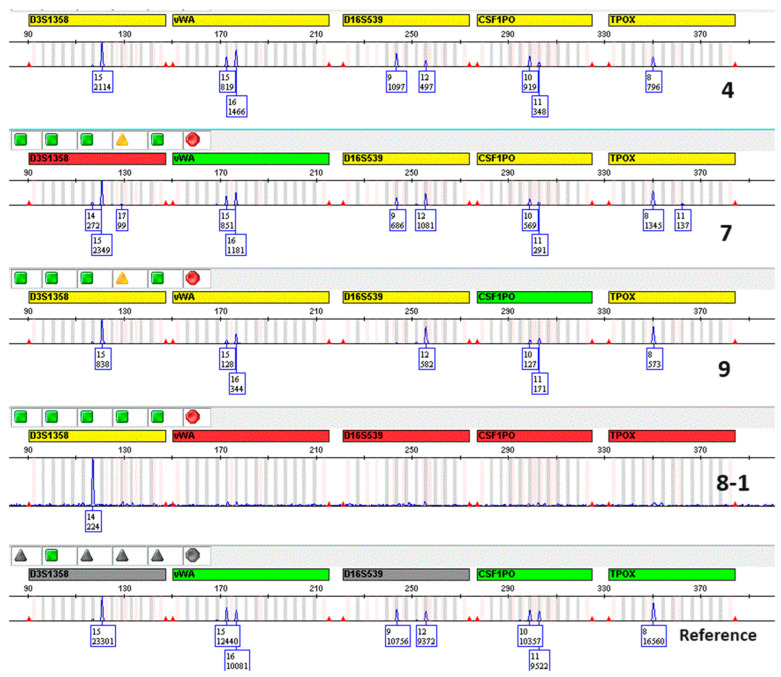
Figure 8.
Amplification results using Globalfiler™ PCR Amplification kit. The figure shows the electropherograms for the same samples as in Figure 7, compared to the reference DNA from a saliva sample of the donor (only the blue channel is shown). Although some “drop-in” and “drop-out” phenomena were observed in some loci, the donor’s genetic profile is evident for almost all DNA markers.

