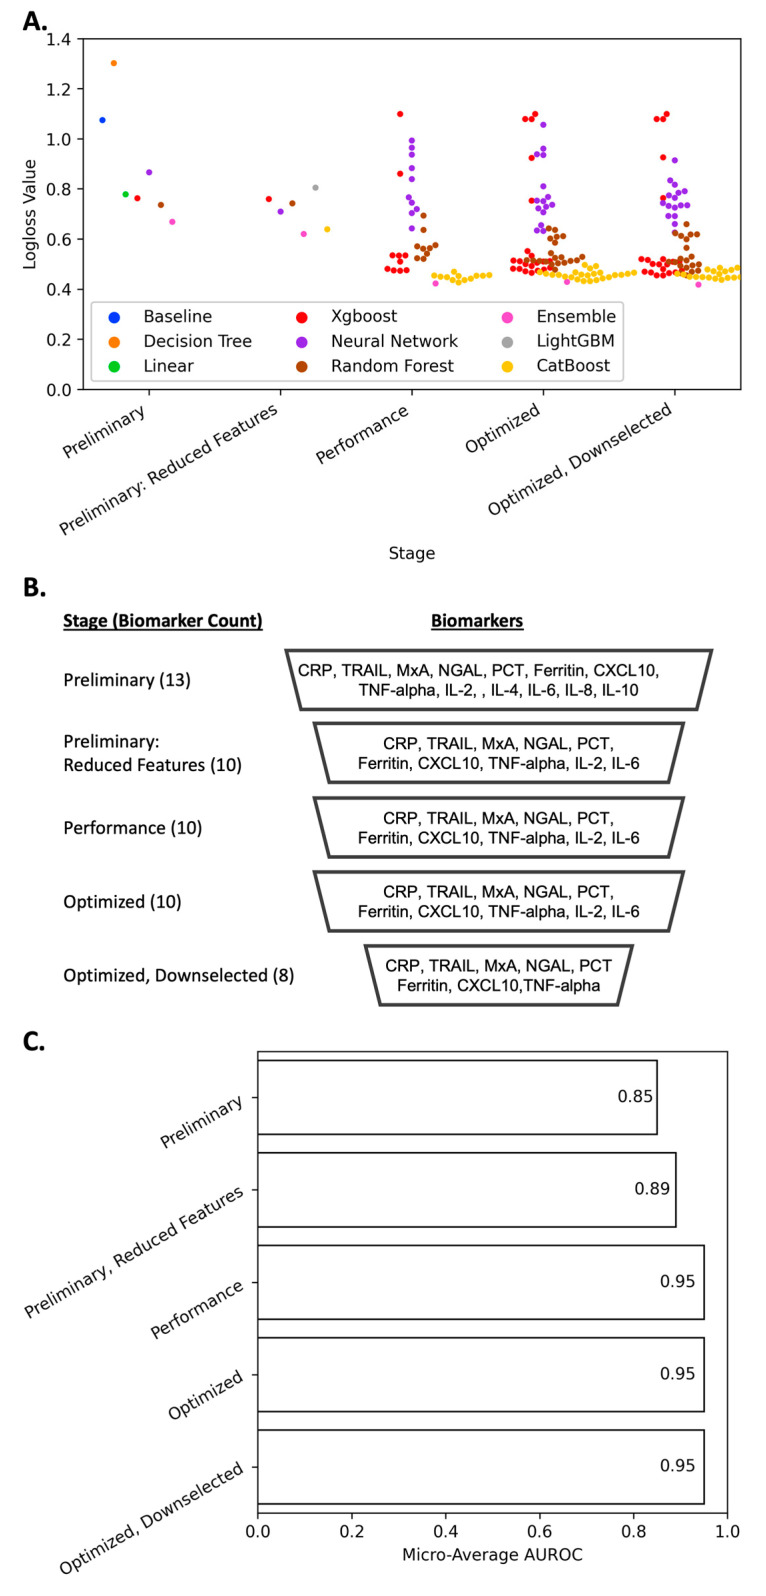
Figure 3.
(A). Performance improvement of different ML models over the course of iterative Auto-ML process. Lower logloss scores convey improved model performance metrics relative to true classifier identity. (B). Biomarker features used at each stage of machine learning model development. (C). The micro-average of the area under the ROC curve (AUROC) for the best performing model at each stage. For each model, a ROC curve is made for each class individually, and then the micro-average is an aggregate measurement that takes the average across all classes, thus giving each class equal importance.

