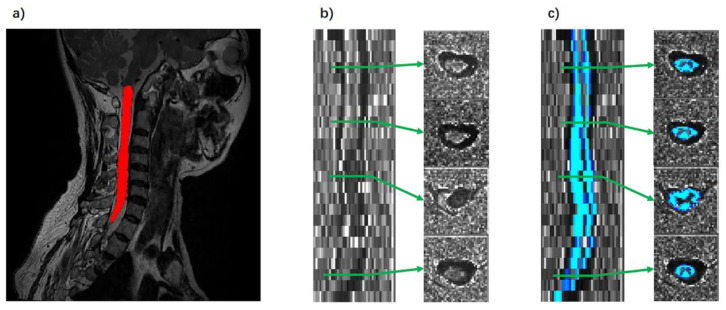
Figure 2.
Demonstration of processing of structural and DTI images. (a) Automatic segmentation of structural images. (b) Fractional anisotropy (FA) maps of a patient with a cervical tumor. The tumor lesion showed abnormal signals on the spinal cord (third image from the top right). (c) Demonstration of white matter segmentation of FA maps. Red indicates the cord segmentation results. Blue indicates the white matter segmentation results. Green arrows indicate different slices.

