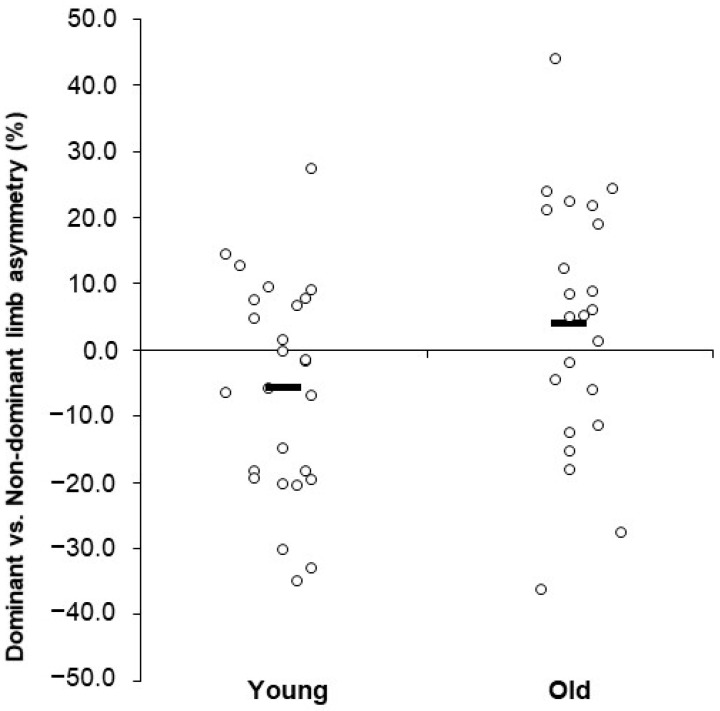
Figure 2.
Scatterplot showing the individual limb differences (asymmetry %) for the young and old participants for the Biodex concentric peak power at 60 deg/s variable. Note: This variable showed a significant group × limb interaction, with the young showing greater values for the non-dominant vs. the dominant limb, whereas there was no limb difference for the old group. Horizontal bars are group means.

