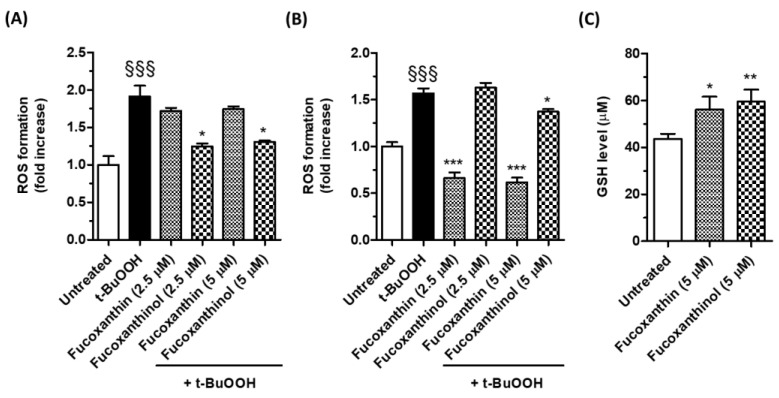
Figure 3.
Effects of carotenoids on ROS formation in SH-SY5Y cells. (A) Cells were treated at the same time with the studied carotenoids (2.5–5 µM) and t-BuOOH (100 µM) for 30 min; (B) cells were treated for 24 h with the studied carotenoids (2.5–5 µM) and then with t-BuOOH (100 µM) for 30 min. After the different treatments, ROS formation was determined using the fluorescent probe DCFH-DA. Data are expressed as a fold increase in ROS formation induced by t-BuOOH and shown as mean ± SD of three independent experiments (§§§ p < 0.001 vs. untreated cells; * p < 0.05 and *** p < 0.001 vs. cells treated with t-BuOOH, one-way ANOVA with Tukey post hoc test); (C) cells were treated for 24 h with the studied carotenoids at a concentration of 5 µM. At the end of treatment, the GSH level was determined using the fluorescent probe MCB. Data are expressed as micromolar of GSH and shown as mean ± SD of three independent experiments (* p < 0.05 and ** p < 0.01 vs. untreated cells, one-way ANOVA with Tukey post hoc test).

