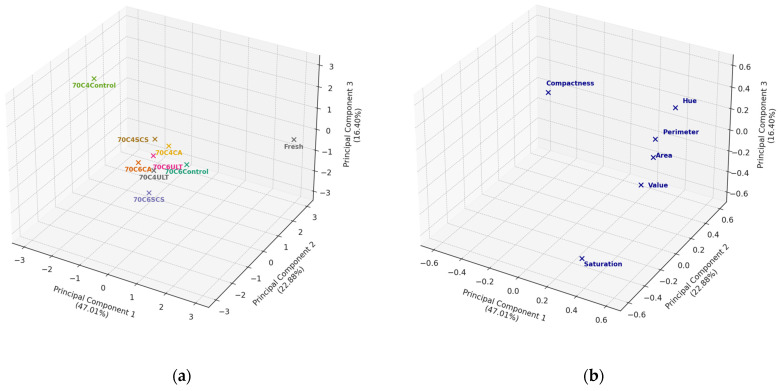
Figure 8.
(a) PCA score plot of the first three principal components was used to explore the degree of variation in the appearance for different pretreatments for 70 °C samples; (b) PCA loading plot of the first three principal components allowing the determination of the relationships between different appearance variables.

