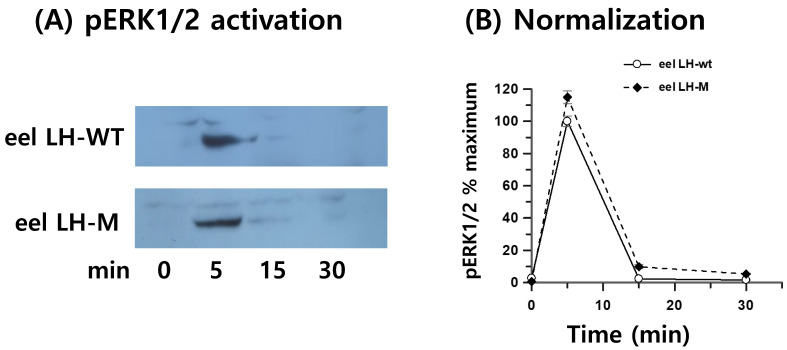
Figure 8.
pERK1/2 activation stimulated by the eel FSH receptor. (A) Western blot results for pERK1/2. (B) Western blot results normalized as maximal response % (100% for eel LH-wt at 5 min). The eel LH receptor cDNA was transiently transfected into HEK293 cells, which were starved for 4–6 h and then stimulated with 400 ng/mL agonists for the indicated times. Whole cell lysates were analyzed to determine the levels of pERK1/2 and total ERK. Twenty micrograms of protein were loaded into each sample lane. The pERK1/2 band was quantified via densitometry, and pERK1/2 was normalized to the level of total ERK. Representative data are shown, and the graphs contain the mean ± SE values of three independent experiments. No significant differences were observed between the curves of the tethered eel LH-wt- and LH-M-treated samples.

