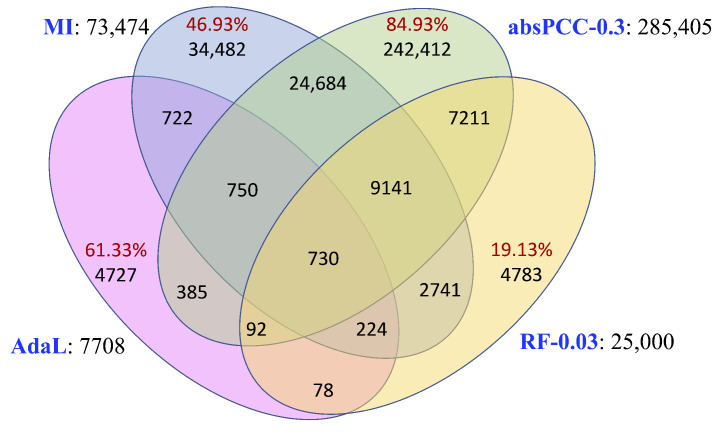
Figure 2.
The edge overlaps between the four networks. Each network’s name is colored in blue and is followed by its corresponding number of edges. Within the Venn diagram, each red number is the percentage of all edges in its corresponding network that are unique to the given network. For example, out of all 7708 edges in AdaL, 4727 (i.e., 61.33% of the) edges are unique to AdaL. More detailed information can be found in Supplementary Figure S2.

