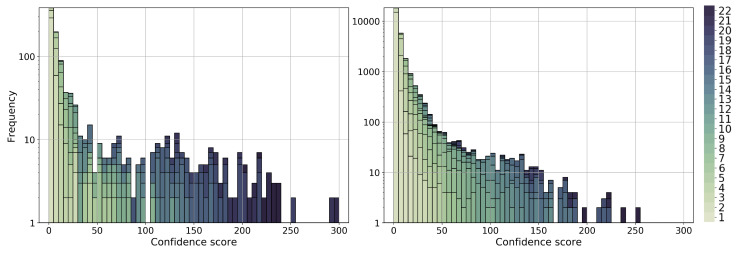
Figure 7.
The distribution of confidence scores for predicted gene–GO term associations. The left panel shows the distribution for existing associations, i.e., true positives, and the right panel shows the confidence score distribution for novel associations. The color shades represent the number of combinations of a network and clustering method that support the corresponding association. The darker color the color, the higher the support. Analogous results for gene–gene interactions are shown in Supplementary Figure S8.

