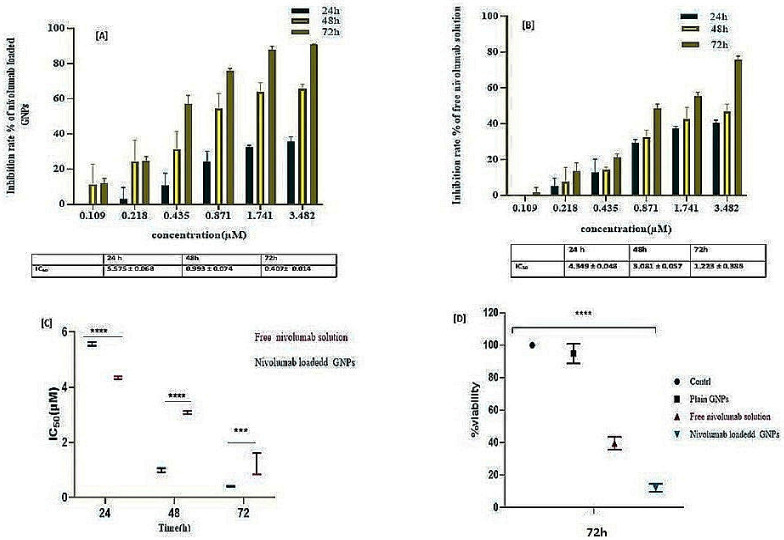
Figure 8.
The proliferation of A549/Jurkat cells is determined by MTS assay. (A) The IC50 of nivolumab-loaded GNPs showed a significant decrease at various time intervals. (B) Displays a significant change in IC50 for free nivolumab solution at different concentrations and time intervals. (C) Shows a significant difference (**** p < 0.0001, *** p = 0.0007) between the loaded and free nivolumab. (D) Displays a significance difference (**** p < 0.0001) when comparing the % viability of nivolumab-loaded GNPs with free nivolumab solution using one-way ANOVA.

